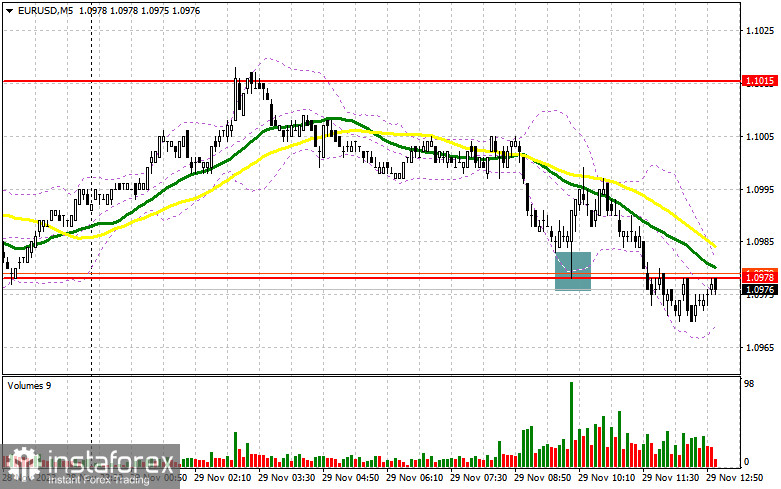
In my morning forecast, I drew attention to the level of 1.0978 and recommended making decisions on market entry based on it. Let's take a look at the 5-minute chart and analyze what happened there. The decline and the formation of a false breakout at this level signaled a euro buy, but after a 15-point upward movement, pressure on the pair returned, and trading again shifted to the 1.0978 area. For this reason, the technical picture was slightly revised for the second half of the day.
To open long positions on EUR/USD, the following is required:
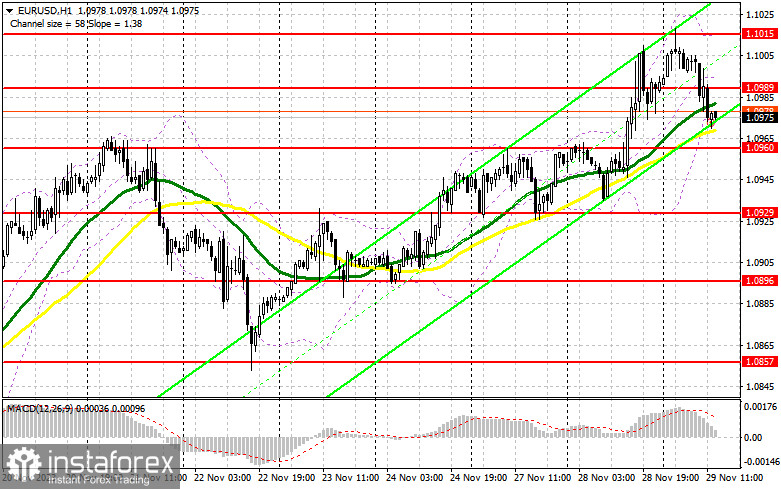
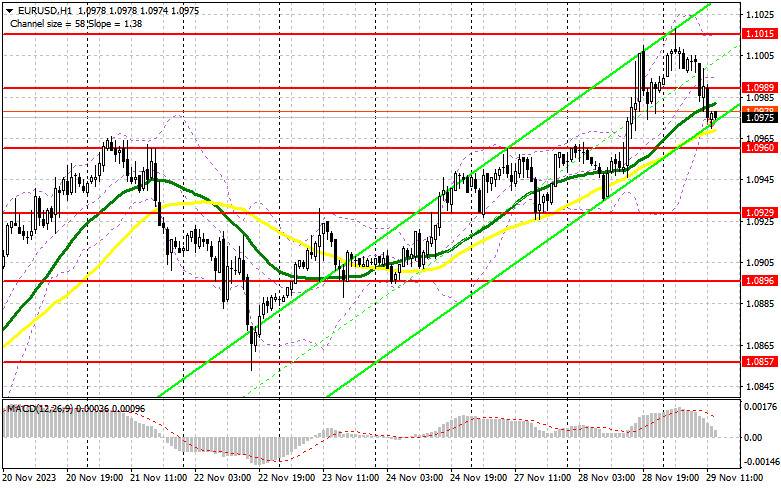
Considering the lack of eagerness to buy the euro around 1.0978, it can be assumed that pressure on the pair will only increase in the second half of the day after the release of good US statistics. Data on changes in GDP for the third quarter of this year and the trade balance in goods are expected. If the figures are revised upward, sellers will try to reach new support at 1.0960, where I plan to act. A decline and the formation of a false breakout there will provide another entry point for long positions, anticipating a pair rise and a test of the new resistance at 1.0989, formed by the end of the day. Its breakout and confirmation from the top down will depend on statements by FOMC member Loretta Mester, signaling a buy and a chance to update the maximum around 1.1015. The ultimate target will be the area of 1.1058, where I will take profits. In the scenario of a further decline in EUR/USD and the absence of activity at 1.0960 in the second half of the day, trading will move within the framework of a broader sideways channel. In this case, entering the market will be possible after the formation of a false breakout around 1.0929. I will consider opening long positions immediately on a rebound from 1.0896 with a target of a 30-35 point upward correction within the day.
To open short positions on EUR/USD, the following is required:
Sellers are gradually suppressing the euro, and to prove their presence in the market, it would be nice for them to show themselves around the intermediate resistance at 1.0989, where growth may occur after the release of US data. The formation of a false breakout at this level will provide an excellent sell signal, anticipating another downward correction and a test of support at 1.0960, just above which the moving averages are located, favoring buyers. Only after breaking and consolidating below this range, as well as a bottom-up retest, do I expect to get another sell signal with an exit to 1.0929. The ultimate target will be a minimum of 1.0896, where I will take profits. Testing this level can seriously affect the prospects for buyers. In the event of an upward movement of EUR/USD during the American session against the backdrop of dovish statements by Federal Reserve representatives similar to yesterday and the absence of bears at 1.0989, the development of a bullish market will continue. This will open the way for buyers to a maximum of 1.1015. It can be sold there, but only after an unsuccessful consolidation. I will consider opening short positions immediately on a rebound from 1.1058 with a target of a 30-35-point downward correction.
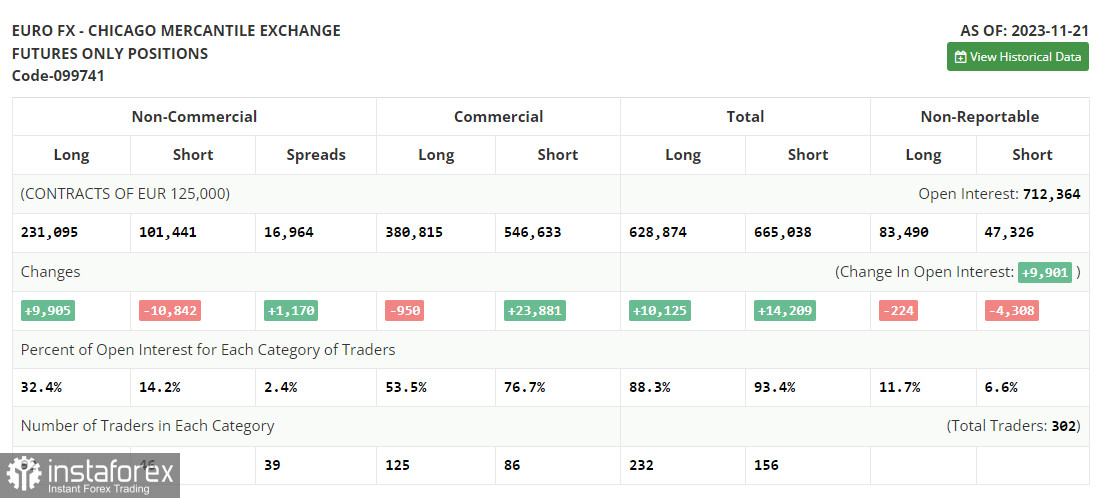
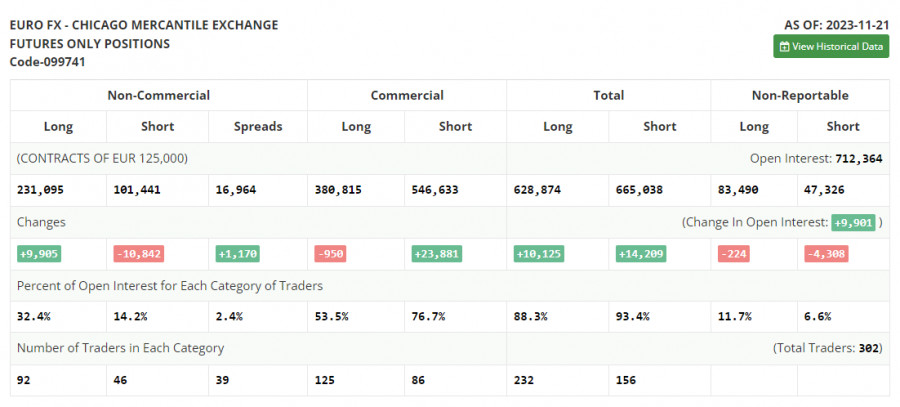
In the COT report (Commitment of Traders) for November 21, there was an increase in long positions and another significant reduction in shorts. Statements by representatives of the European Central Bank and their commitment to high-interest rates led to new purchases of the euro last week, as did PMI index activity data, which demonstrated a slight recovery in some Eurozone countries, leaving a chance to avoid a recession in the fourth quarter of this year. The publication of the minutes of the November meeting of the US Federal Reserve slightly cooled risk asset buyers but did not affect the development of the bullish trend. A lot of important fundamental statistics related to inflation and consumer confidence will be released soon, which will affect market direction. The COT report indicates that non-commercial long positions increased by 9,905 to 231,095, while non-commercial short positions decreased by 10,842 to 101,441. As a result, the spread between long and short positions increased by 1,170. The closing price increased and reached 1.0927 against 1.0902.
Indicator Signals:
Moving Averages
Trading is carried out around the 30 and 50-day moving averages, indicating market uncertainty.
Note: The period and prices of moving averages are considered by the author on the hourly chart H1 and differ from the general definition of classic daily moving averages on the daily chart D1.
Bollinger Bands
In case of a decline, the lower boundary of the indicator around 1.0970 will act as support.
Indicator Descriptions:
- Moving Average (smoothes volatility and noise, determines the current trend). Period 50. Marked in yellow on the chart.
- Moving Average (smoothes volatility and noise, determines the current trend). Period 30. Marked in green on the chart.
- MACD (Moving Average Convergence/Divergence). Fast EMA period 12. Slow EMA period 26. SMA period 9.
- Bollinger Bands. Period 20.
- Non-commercial traders - speculators, such as individual traders, hedge funds, and large institutions, use the futures market for speculative purposes and meet certain requirements.
- Non-commercial long positions represent the total long open position of non-commercial traders.
- Non-commercial short positions represent the total short open positions of non-commercial traders.
- The total non-commercial net position is the difference between non-commercial long and short positions.