empty
24.01.2024 04:32 PM
Trading Signals for BTC/USD (Bitcoin) on January 24-26, 2024: sell below $40,635 (21 SMA - 2/8 Murray)

This image is no longer relevant

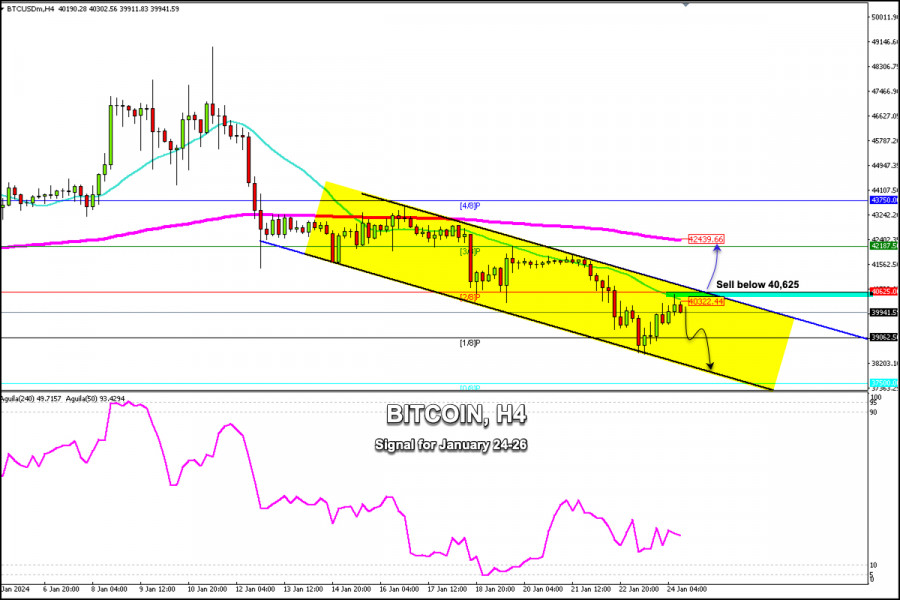
Early in the American session, Bitcoin is trading around 39,941 and below a downtrend channel, forming since January 10. Yesterday in the American session, Bitcoin fell to a low of 38,489, a level that coincided with the bottom of the trending channel.

In the chart, we can see that once BTC touched the bottom of the bearish channel, a strong technical rebound occurred, reaching the psychological level of $40,000.

If Bitcoin consolidates above 40,600 (2/8 Murray) in the next few hours, we could expect it to begin a more sustained recovery and the price could reach the 200 EMA at 42,439 in the short term and could even reach 4/8 Murray located at 43,700.

If Bitcoin continues to trade within the downtrend channel in the next few hours, the bearish cycle is likely to resume and it could be seen as an opportunity to sell below 40,600 with the targets at 1/8 Murray located at 39,062. BTC could even reach 0/8 Murray located at 37,500.

The main trend remains bearish for Bitcoin. Therefore, the most efficient strategy could be to sell below the top of the downtrend channel. The trend could reverse if BTC consolidates above 40,700. The eagle indicator is giving a negative signal. So, Bitcoin is likely to reach 37,000 in the coming days.

Ringkasan
Segera
Analitic
Dimitrios Zappas
Mulakan perdagangan
Jana pendapatan melalui perubahan kadar mata wang kripto dengan InstaForex.
Muat turun MetaTrader 4 dan buka dagangan pertama anda.
  • Grand Choice
    Contest by
    InstaForex
    InstaForex always strives to help you
    fulfill your biggest dreams.
    SERTAI PERADUAN

Artikel yang dicadangkan

Indeks Dolar Hari Ini Berpotensi Mencuba Tahap Pivot. Jika Gagal Menembusi, Ia Mungkin Melemah Semula. Selasa, 09 September 2025.

[USDX] – [Selasa, 09 September 2025] Walaupun terdapat perbezaan di antara RSI dan pergerakan harga USDX, tetapi dengan EMA kini dalam pembentukan Death Cross dan RSI dalam zon Neutral-Bearish, #USDX

Arief Makmur 07:45 2025-09-09 UTC+2

Perak Meneruskan Pengukuhannya Ke Arah Rintangan Terdekat Hari Ini. Selasa, 09 September 2025.

[XAG/USD] – [Selasa, 09 September 2025] EMA(50) membentuk Silangan Emas dengan EMA(200) dan RSI berada di tahap Neutral-Menaik memberikan potensi untuk Perak meneruskan pengukuhan menuju rintangan terdekat hari ini. Tahap-Tahap

Arief Makmur 07:45 2025-09-09 UTC+2

Ramalan EUR/USD untuk 9 September 2025

EUR/USD Euro berjaya naik melebihi garis penunjuk MACD dan kekal di atasnya. Pengayun Marlin semakin meningkat, dan harga mungkin mencapai sempadan atas saluran harga sekitar 1.1880. Hari ini, data inflasi

Laurie Bailey 05:12 2025-09-09 UTC+2

Ramalan GBP/USD untuk 9 September 2025

GBP/USD Selepas menguji garis MACD mingguan dengan bayang bawah lilin minggu lalu, pound terus meningkat dengan ketara ke arah sempadan atas saluran harga sekitar paras 1.3700. Jika harga melepasi tahap

Laurie Bailey 05:12 2025-09-09 UTC+2

Ramalan untuk EUR/USD pada 8 September 2025

Pada hari Jumaat, pasangan EUR/USD meneruskan pergerakan menaik selepas membuat lantunan daripada zon sokongan 1.1637–1.1645. Ia berjaya mengukuh di atas paras pembetulan 76.4% pada 1.1695, selepas itu pasangan ini mengalami

Samir Klishi 11:11 2025-09-08 UTC+2

Ramalan untuk GBP/USD pada 8 September 2025

Pada carta jam, pasangan GBP/USD pada hari Jumaat meneruskan pergerakan menaiknya selepas melantun daripada zon sokongan 1.3416–1.3425 dan mengukuh di atas paras pembetulan 76.4% pada 1.3482. Lantunan daripada tahap

Samir Klishi 11:01 2025-09-08 UTC+2

GBP/USD. Analisis teknikal untuk minggu 8–13 September

Minggu lepas, pasangan ini bergerak ke bawah, menguji garis sokongan pada 1.3332 (garis biru tebal), dan kemudian bergerak ke atas, menutup graf lilin mingguan pada 1.3506. Pada minggu hadapan, harga

Stefan Doll 10:36 2025-09-08 UTC+2

EUR/USD. Analisis teknikal untuk minggu 8–13 September

Minggu lepas, pasangan mata wang ini bergerak ke bawah, menguji EMA 13-hari pada 1.1612 (garis kuning nipis), dan kemudian bergerak ke atas, menutup graf lilin mingguan pada 1.1718. Pada minggu

Stefan Doll 10:16 2025-09-08 UTC+2

GBP/USD. Analisis penunjuk pada 8 September 2025

Pada hari Jumaat, pasangan ini bergerak ke atas, menguji tahap rintangan sejarah pada 1.3543 (garisan titik biru), dan kemudian bergerak ke bawah, menutup lilin harian pada 1.3506. Hari ini, harga

Stefan Doll 10:09 2025-09-08 UTC+2

EUR/USD. Analisis penunjuk pada 8 September 2025

Pada hari Jumaat, pasangan ini bergerak ke atas, menguji fraktal atas pada 1.1742 (garis putus-putus biru), dan kemudian bergerak ke bawah, menutup lilin harian pada 1.1718. Hari ini, harga mungkin

Stefan Doll 10:01 2025-09-08 UTC+2
Tidak boleh bertanya sekarang?
Tanya soalan anda di Ruangan bersembang.
Panggilan semula Widget
 

Dear visitor,

Your IP address shows that you are currently located in the USA. If you are a resident of the United States, you are prohibited from using the services of InstaFintech Group including online trading, online transfers, deposit/withdrawal of funds, etc.

If you think you are seeing this message by mistake and your location is not the US, kindly proceed to the website. Otherwise, you must leave the website in order to comply with government restrictions.

Why does your IP address show your location as the USA?

  • - you are using a VPN provided by a hosting company based in the United States;
  • - your IP does not have proper WHOIS records;
  • - an error occurred in the WHOIS geolocation database.

Please confirm whether you are a US resident or not by clicking the relevant button below. If you choose the wrong option, being a US resident, you will not be able to open an account with InstaForex anyway.

We are sorry for any inconvenience caused by this message.