empty
31.03.2023 08:30 AM
GBP/USD: trading plan for European session on March 31, 2023. Commitments of Traders report. GBP/USD to hit fresh monthly highs

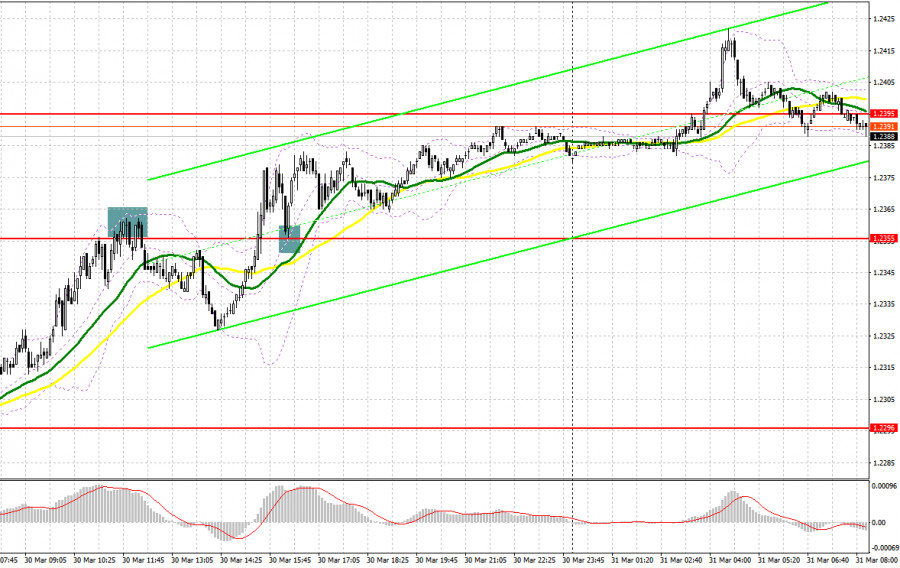
A few nice entry signals were generated yesterday. Let's look at the M5 chart to get a picture of what happened. In my previous review, I considered entering the market at 1.2355. A sell signal was made after a rise in the price and a false breakout by the middle of the day. The pair dropped by 30 pips. A breakout and a retest of the 1.2355 mark took place in the North American session, which produced a buy entry point and brought a profit of about 25 pips.

This image is no longer relevant

When to open long positions on GBP/USD:

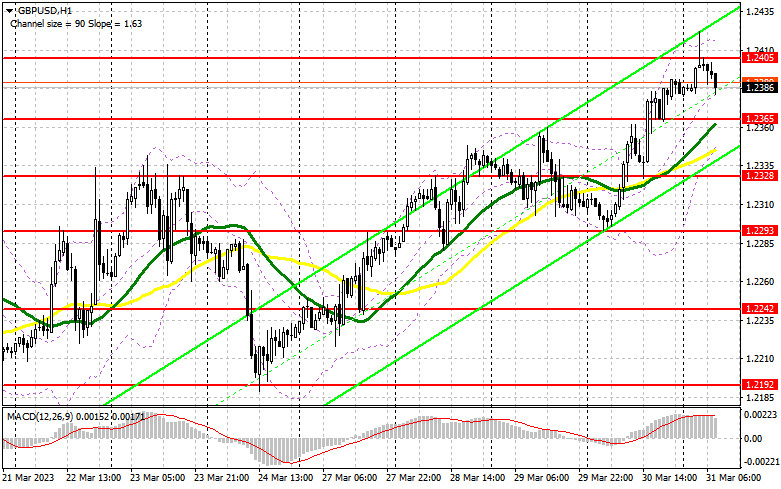
In the European session, a series of macro releases is expected, including data on UK GDP, current account, and business investments. Nevertheless, all eyes will be on the Nationwide house price index. If this report does not trigger a strong bearish reaction, the bulls will attempt to push the price above 1.2405 and update monthly highs. Of course, with the pound being at such a high level right now, it would be wiser to buy when the price falls and a false breakout through support at 1.2365 occurs. In fact, the barrier is in line with the bullish moving averages. This will make a buy signal, targeting 1.2405. After consolidation and a downside test of this range, GBP/USD may head toward 1.2443, where the bulls are likely to feel pressure. After a breakout through this range, the price may go to 1.2505, where I am going to take profit. If the bulls lose control over 1.2365, a deep bearish correction may occur by the end of the week. In such a case, the trading plan will be to buy after a false breakout through support at 1.2328. Likewise, long positions could be opened after a bounce off the 1.2293 low, allowing a correction of 30 to 35 pips intraday.

When to open short positions on GBP/USD:

This week, bullish sentiment in the market is fuelled by the statements from Bank of England officials who advocate for more rate increases. So, the bears have nothing to do about it. A bearish correction is likely to occur only if the pair attempts to go above 1.2405 after the publication of macro releases. A false breakout through the mark will make a signal to sell the instrument against the trend, targeting intermediate support at 1.2365. I expect some bullish activity at this level. A sell signal will be generated after a breakout and an upside retest of the 1.2365 mark. Target will stand at 1.2328 and 1.2293. However, the pair may approach the 1.2293 low if macro data in the US comes upbeat. In case GBP/USD ascends and there is no trading activity at 1.2405, which is highly likely, the bulls will maintain control over the market, and the pair will head toward a high of 1.2443. A false breakout through the mark will create a sell entry point. If no drop follows, I am going to sell GBP/USD on a bounce off the 1.2505 high, allowing a downward correction of 30 to 35 pips intraday.
This image is no longer relevant

Commitments of Traders:

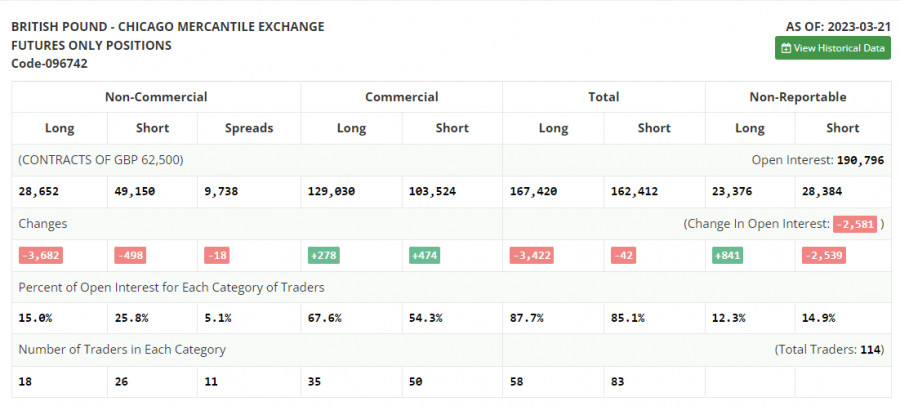
According to the COT report for March 21, long and short positions both decreased. The March meeting of the Bank of England did not bring any surprises. As widely expected, the regulator raised the interest rate, hinting at further monetary tightening due to persistent inflation in the UK. The latest data revealed a rise in consumer prices in February, which forced the regulator to maintain a hawkish stance. Given that many expect the Fed to pause monetary tightening, the pound sterling could extend its upward movement. The latest COT report showed that short non-commercial positions decreased by 498 to 49,150, while long non-commercial positions declined by 3,682 to 28,652. As a result, the non-commercial net position came in at -20,498 versus -17,314 a week earlier. The weekly closing price climbed to 1.2241 against 1.2199.

This image is no longer relevant

Indicator signals:

Moving averages

Trading is carried out above the 30-day and 50-day moving averages, indicating a bullish bias.

Note: The period and prices of moving averages are viewed by the author on the hourly chart and differ from the general definition of classic daily moving averages on the daily chart.

Bollinger Bands

Support stands at 1.2365, in line with the lower band.

Indicator description:

  • Moving average (MA) determines the current trend by smoothing volatility and noise. Period 50. Colored yellow on the chart.
  • Moving average (MA) determines the current trend by smoothing volatility and noise. Period 30. Colored green on the chart.
  • Moving Average Convergence/Divergence (MACD). Fast EMA 12. Slow EMA 26. SMA 9.
  • Bollinger Bands. Period 20
  • Non-commercial traders are speculators such as individual traders, hedge funds, and large institutions who use the futures market for speculative purposes and meet certain requirements.
  • Long non-commercial positions are the total long position of non-commercial traders.
  • Non-commercial short positions are the total short position of non-commercial traders.
  • Total non-commercial net position is the difference between the short and long positions of non-commercial traders.
Pilih carta masa
5
min
15
min
30
min
1
jam
4
jam
1
hari
1
minggu
Jana pendapatan melalui perubahan kadar mata wang kripto dengan InstaForex.
Muat turun MetaTrader 4 dan buka dagangan pertama anda.
  • Grand Choice
    Contest by
    InstaForex
    InstaForex always strives to help you
    fulfill your biggest dreams.
    SERTAI PERADUAN

Artikel yang dicadangkan

Bagaimana untuk Berdagang Pasangan EUR/USD pada 10 Jun? Tip Ringkas dan Analisis Dagangan untuk Pedagang Baharu

Pasangan mata wang EUR/USD didagangkan dengan volatiliti rendah dan dalam kedua-dua arah pada hari Isnin. Pada hari tersebut, latar belakang makroekonomi hampir tiada, menyebabkan pedagang kekurangan perkara untuk diambil tindakan

Paolo Greco 06:40 2025-06-10 UTC+2

Cadangan Dagangan dan Analisis untuk GBP/USD pada 10 Jun: Pound Juga Tidak Bergegas untuk Jatuh

Analisis GBP/USD carta 5 Minit Pada hari Isnin, pasangan mata wang GBP/USD secara dijangka gagal untuk meneruskan pergerakan menurunnya. Perlu diingatkan bahawa sebelum ini, harga sekali lagi membentuk isyarat untuk

Paolo Greco 04:11 2025-06-10 UTC+2

Cadangan dan Analisis Dagangan untuk EUR/USD pada 10 Jun: Satu Lagi Hari, Satu Lagi Dos Negatif

Pada hari Isnin, pasangan mata wang EUR/USD didagangkan secara bercampur. Walaupun telah melepasi garisan arah aliran, pergerakan ke bawah (iaitu pengukuhan dolar AS) tidak benar-benar bermula. Oleh itu, isyarat teknikal

Paolo Greco 04:11 2025-06-10 UTC+2

GBP/USD: Rancangan Dagangan untuk Sesi A.S. pada 9 Jun (Analisis Dagangan Pagi)

Dalam ramalan pagi saya, saya memberi tumpuan kepada tahap 1.3581 dan merancang untuk membuat keputusan kemasukan berdasarkannya. Mari kita lihat carta 5 minit dan lihat apa yang berlaku. Kenaikan

Miroslaw Bawulski 14:16 2025-06-09 UTC+2

EUR/USD: Rancangan Dagangan untuk Sesi Amerika Syarikat pada 9 Jun (Analisis Dagangan Pagi)

Dalam ramalan pagi, saya memberi tumpuan kepada paras 1.1430 dan merancang untuk membuat keputusan kemasukan berdasarkan paras tersebut. Mari kita lihat carta 5 minit dan lihat apa yang berlaku. Pasangan

Miroslaw Bawulski 14:09 2025-06-09 UTC+2

Bagaimanakah untuk Berdagang Pasangan GBP/USD pada 9 Jun? Petua Ringkas dan Analisis Dagangan kepada Pedagang Baharu

Analisis Dagangan Hari Jumaat Carta 1-Jam pasangan GBP/USD Pasangan GBP/USD turut diniagakan lebih rendah pada hari Jumaat atas sebab yang sama seperti pasangan EUR/USD. Dolar menerima sokongan minimum daripada pasaran

Paolo Greco 05:54 2025-06-09 UTC+2

Bagaimana Berdagang Pasangan EUR/USD pada 9 Jun? Tip Ringkas dan Analisis Dagangan untuk Pedagang Baharu

Pasangan mata wang EUR/USD diniagakan lebih rendah pada hari Jumaat, dan terdapat sebab-sebab objektif untuk perkara ini. Walau bagaimanapun, penting untuk diperhatikan bahawa pada penghujung hari, dolar telah mengukuh sebanyak

Paolo Greco 05:54 2025-06-09 UTC+2

Cadangan Dagangan dan Analisis untuk GBP/USD pada 9 Jun: Pound Sekali Lagi Mengubah Arah Aliran

Analisis GBP/USD carta 5-Minit Pada hari Jumaat, pasangan mata wang GBP/USD diniagakan lebih rendah, dan memandangkan garisan arah aliran berada sangat hampir dengan harga, penurunan minimum sudah mencukupi untuk menembusinya

Paolo Greco 03:33 2025-06-09 UTC+2

Cadangan Dagangan dan Analisis untuk EUR/USD pada 9 Jun: Berapa Lama Dolar Akan Meningkat Kali Ini?

Pada hari Jumaat, pasangan mata wang EUR/USD meneruskan penurunan yang agak perlahan dan mengakhiri hari berhampiran garisan arah aliran menaik yang sudah dikenali. Ingat bahawa kira-kira 10 hari yang lalu

Paolo Greco 03:33 2025-06-09 UTC+2

GBP/USD: Rancangan Dagangan untuk Sesi A.S. pada 6 Jun (Ulasan Dagangan Pagi)

Dalam ramalan pagi saya, saya menekankan tahap 1.3544 dan merancang untuk membuat keputusan masuk pasaran berdasarkan tahap tersebut. Mari kita lihat pada carta 5 minit dan lihat apa yang berlaku

Miroslaw Bawulski 15:38 2025-06-06 UTC+2
Tidak boleh bertanya sekarang?
Tanya soalan anda di Ruangan bersembang.
Panggilan semula Widget
 

Dear visitor,

Your IP address shows that you are currently located in the USA. If you are a resident of the United States, you are prohibited from using the services of InstaFintech Group including online trading, online transfers, deposit/withdrawal of funds, etc.

If you think you are seeing this message by mistake and your location is not the US, kindly proceed to the website. Otherwise, you must leave the website in order to comply with government restrictions.

Why does your IP address show your location as the USA?

  • - you are using a VPN provided by a hosting company based in the United States;
  • - your IP does not have proper WHOIS records;
  • - an error occurred in the WHOIS geolocation database.

Please confirm whether you are a US resident or not by clicking the relevant button below. If you choose the wrong option, being a US resident, you will not be able to open an account with InstaForex anyway.

We are sorry for any inconvenience caused by this message.