empty
02.04.2023 01:35 PM
Technical analysis of EUR/USD for April 02, 2023

This image is no longer relevant

Overview :

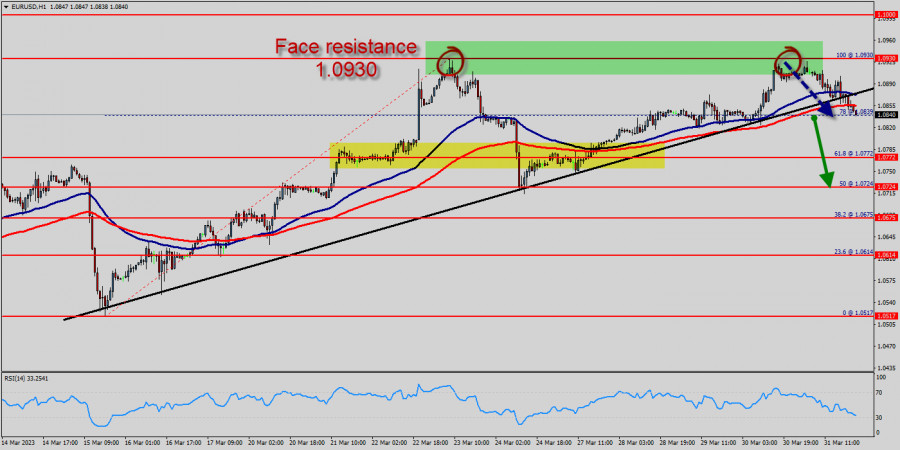
The EUR/USD pair faced strong resistances at the level of 1.0930 because this price coincided with the double top on the hourly chart since two weeks. So, the strong resistance has been already formed at the level of 1.0930 and the pair is likely to try to approach it in order to test it again, but the trend failed thrice.

Briefly, last week the EUR/USD pair traded higher and closed the day in the positive territory around 1.0930. It has also risen a little, having risen to the level of 1.0930. On the hourly chart, the GBP/USD pair is still trading above the MA (100) H1 moving average line (1.0840).

The situation is similar on the one-hour of 4H chart. Based on the foregoing, it is probably worth sticking to the south direction in trading, and as long as the GBP/USD pair remains below MA 100 H1, it may be necessary to look for entry points to buy for the formation of a correction.

However, if the pair fails to pass through the level of 1.0930 in coming two days, the market will indicate a bearish opportunity below the new strong resistance level of 1.0930 (the level of 1.0930 coincides with a ratio of 100% Fibonacci - last bullish wave - double top).

Moreover, the RSI starts signaling a downward trend, as the trend is still showing strength above the moving average (100) and (50). Thus, the market is indicating a bearish opportunity below 1.0930 so it will be good to sell at 1.0930 with the first target of 1.0772.

It will also call for a downtrend in order to continue towards 1.0724. The daily strong support is seen at 1.0675.

On the other hand, the stop loss should always be taken into account, for that it will be reasonable to set your stop loss at the level of 1.0930.

It should be noticed, the EUR/USD pair is the forex ticker that shows the value of the Euro against the US Dollar. It tells traders how many US Dollars are needed to buy a Euro. The Euro is one of the oldest and most widely traded currency pairs in the world. Follow the live EUR/USD rate with the chart and keep up to date with Euro news and analysis. Plan your trades with the EUR/USD forecast .

Probably, the main scenario is continued decrease to 1.0724 (session low).

The alternative scenario is consolidation above the MA 100 H1 level (1.0675), followed by a climp to 1.0930 (March 31 high).

Pilih carta masa
5
min
15
min
30
min
1
jam
4
jam
1
hari
1
minggu
Jana pendapatan melalui perubahan kadar mata wang kripto dengan InstaForex.
Muat turun MetaTrader 4 dan buka dagangan pertama anda.
  • Grand Choice
    Contest by
    InstaForex
    InstaForex always strives to help you
    fulfill your biggest dreams.
    SERTAI PERADUAN

Artikel yang dicadangkan

EUR/USD. 12 Jun. Tekanan Terbaharu ke Atas Dolar

Selamat sejahtera, para pedagang yang dihormati! Pada hari Rabu, pasangan EUR/USD meneruskan pergerakan menaik setelah melantun semula dari zon sokongan 1.1374–1.1380. Ia berjaya disokong di atas tahap pemulihan semula Fibonacci

Samir Klishi 10:15 2025-06-12 UTC+2

Analisis Teknikal Pergerakan Harga Harian Instrumen Komoditi Minyak Mentah, Khamis 12 Jun 2025.

Jika kita melihat carta harian bagi instrumen komoditi Minyak Mentah, terdapat Perbezaan di antara pergerakan harga #CL dan penunjuk Pengayun Stochastic, yang menunjukkan kemungkinan #CL akan mengalami pembetulan penyusutan dalam

Arief Makmur 08:10 2025-06-12 UTC+2

Analisis Teknikal Pergerakan Harga Harian Indeks Nasdaq 100, Khamis 12 Jun 2025.

Pada carta 4 jam indeks Nasdaq 100, terdapat perbezaan antara pergerakan harga dan penunjuk Pengayun Stochastic, terutamanya dengan pengesahan pergerakan harga semasa #NDX yang bergerak di bawah EMA (21), maka

Arief Makmur 08:10 2025-06-12 UTC+2

Isyarat Dagangan untuk EUR/USD bagi 12-19 Jun, 2025: jual di bawah 1.1500 (21 SMA - 8/8 Murray)

Jika harga euro jatuh di bawah 1.1500 dalam beberapa jam akan datang, ini boleh dilihat sebagai peluang untuk menjual. Dari sudut teknikal, ia kelihatan terlebih belian pada carta

Dimitrios Zappas 05:33 2025-06-12 UTC+2

Isyarat Dagangan EMAS (XAU/USD) untuk 12-19 Jun 2025: jual di bawah $3,386 (21 SMA - 7/8 Murray)

Aliran XAU/USD kekal dalam fasa kenaikan selagi harga terus membuat pengukuhan di atas paras 3,331. Oleh demikian, adalah wajar untuk membeli emas selagi harga terus membuat pengukuhan di atas paras

Dimitrios Zappas 05:32 2025-06-12 UTC+2

Ramalan EUR/USD untuk 12 Jun 2025

Data inflasi A.S. yang dikeluarkan pada hari Rabu telah menggoyahkan pasaran: indeks dolar menurun sebanyak 0.47%, minyak WTI melonjak sebanyak 5.54%, emas meningkat sebanyak 1.27%, dan hasil Perbendaharaan A.S

Laurie Bailey 04:40 2025-06-12 UTC+2

Ramalan GBP/USD untuk 12 Jun 2025

Pada hari Rabu, pound British berjaya mengelakkan penurunan di bawah paras sokongan teknikal, lalu berbalik naik dari paras tersebut. Harga membuat lantunan dari garisan penunjuk MACD pada carta harian, manakala

Laurie Bailey 04:40 2025-06-12 UTC+2

Ramalan USD/JPY untuk 12 Jun 2025

Pembetulan harga sejak 27 Mei adalah kompleks dan berlarutan, sekali gus menimbulkan risiko penembusan melebihi paras 146.11. Namun, risiko ini kini tidak lagi menjadi kebimbangan berikutan pembalikan dari paras 145.08

Laurie Bailey 04:40 2025-06-12 UTC+2

Bitcoin: Kekuatan Dolar Boleh Mencetuskan Kejatuhan dalam Pasaran Kripto

Hari ini, tumpuan utama pasaran akan diberikan kepada penerbitan laporan inflasi Amerika Syarikat, yang dijangkakan bukan sahaja menunjukkan penghentian penurunan baru-baru ini, malah mencatatkan kenaikan inflasi tertinggi dalam tempoh empat

Pati Gani 11:47 2025-06-11 UTC+2

EUR/USD. 11 Jun. Amerika Syarikat dan China Tidak Mencapai Sebarang Persetujuan

Pada hari Selasa, pasangan EUR/USD terus bergerak mendatar antara tahap 1.1380 dan 1.1454. Lantunan semula dari tahap anjakan semula Fibonacci 61.8% pada 1.1380 memungkinkan kenaikan lain dalam julat tersebut. Penurunan

Samir Klishi 11:12 2025-06-11 UTC+2
Tidak boleh bertanya sekarang?
Tanya soalan anda di Ruangan bersembang.
Panggilan semula Widget
 

Dear visitor,

Your IP address shows that you are currently located in the USA. If you are a resident of the United States, you are prohibited from using the services of InstaFintech Group including online trading, online transfers, deposit/withdrawal of funds, etc.

If you think you are seeing this message by mistake and your location is not the US, kindly proceed to the website. Otherwise, you must leave the website in order to comply with government restrictions.

Why does your IP address show your location as the USA?

  • - you are using a VPN provided by a hosting company based in the United States;
  • - your IP does not have proper WHOIS records;
  • - an error occurred in the WHOIS geolocation database.

Please confirm whether you are a US resident or not by clicking the relevant button below. If you choose the wrong option, being a US resident, you will not be able to open an account with InstaForex anyway.

We are sorry for any inconvenience caused by this message.