empty
17.03.2023 04:59 PM
EUR/USD: trading plan for the US session on March 17 (analysis of morning deals)

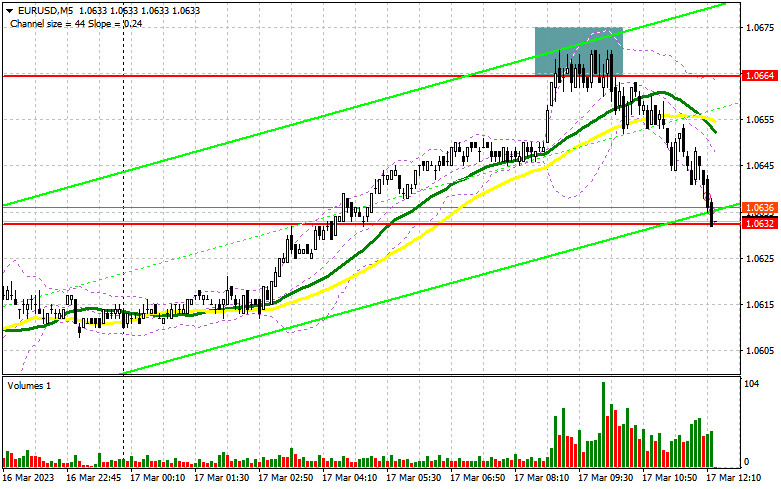
In my morning forecast, I focused on the level of 1.0664 and offered recommendations based on it for market entry decisions. Let's take a look at the 5-minute chart and see what happened. The pair dropped more than 30 points, testing the nearest support at 1.0632, as a result of the increase and development of a false collapse in the area of 1.0664, which served as a sell signal for the euro. The technical situation and the strategy itself have not changed for the second half of the day.

This image is no longer relevant

If you want to trade long positions on EUR/USD, you will need:

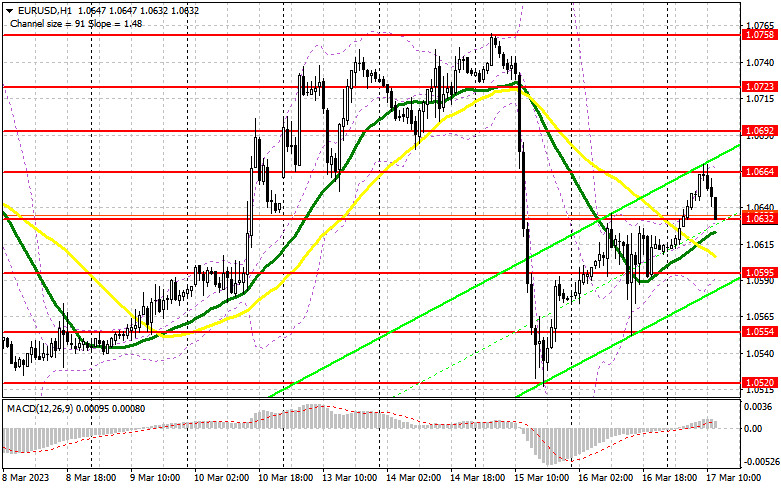
The recent figures on inflation in the eurozone completely matched economists' predictions: total inflation decreased to 8.5% per year, while the base increased from 5.3% to 5.6%. This is completely unhelpful for the European Central Bank and forces it to maintain its tough policymaking. The focus will now shift to the University of Michigan figures on industrial production, the expectations index, and the consumer confidence index in the afternoon. Positive indicators could put more pressure on the euro, which would trigger a struggle for the nearest level of support at 1.0632. The formation of a false breakout there will suggest the opening of long positions in anticipation of another breakthrough at 1.0664 because the technical picture has not changed. This level's breakout and top-down test provide an extra entry point for developing long positions with a move to 1.0692, where bulls will struggle. The bears' stop orders will be hit by the collapse of 1.0692, providing a further signal with the potential to move to 1.0723, where I will fix profits. Nevertheless, only extremely weak data about the American economy will allow for the development of such a situation. The next support level of 1.0595 will be reached if EUR/USD weakens in the afternoon and there are no buyers at 1.0632, which is also likely given that pressure on the euro might resume at any time. Only the emergence of a false collapse will provide a signal to purchase the euro. For a rebound from the low of 1.0554, or even lower (around 1.0520), I will begin long positions right away with the target of an upward corrective of 30-35 points during the day.

If you want to trade short positions on EUR/USD, you'll need:

Sellers managed the morning task and prevented the pair from rising beyond 1.0664. They are now aiming for 1.0632, which is the closest support, but you should also remember that 1.0664 provides protection. The development of a false collapse there, similar to what I stated above, will be the best-case scenario for starting additional short positions if the euro rises higher after the US data. The euro will drop as a result to close to the nearest level of support at 1.0632, just below which the moving averages are supporting the bulls. The pair will drop much more if this range is broken and reversal tested, which will serve as another signal to start short positions with an exit at 1.0595. Fixing below this level upon the release of US data will result in a stronger decline to the area of 1.0554, where I will take profit. As this level has already worked itself out once today, I suggest you delay opening short positions until the level of 1.0692 if the EUR/USD rises throughout the American session and there are no bears at 1.0664. You can sell only after an unsuccessful consolidation. In anticipation of a rebound from the high point of 1.0723, I will open short positions right away with a 30- to 35-point corrective in mind.
This image is no longer relevant

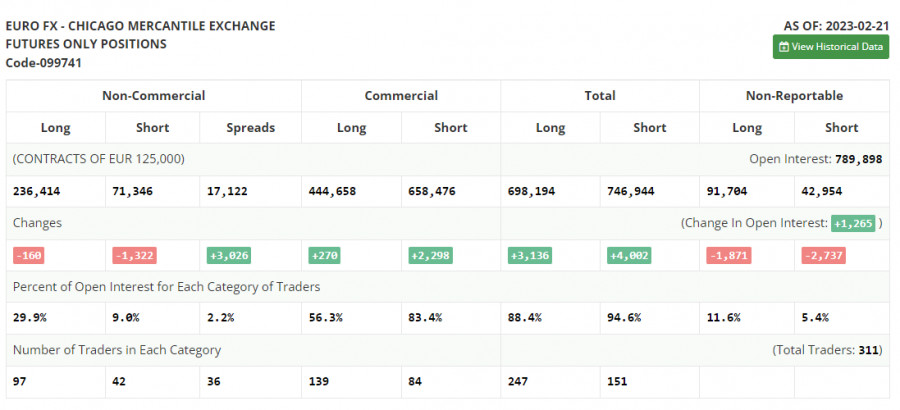
In the COT report (Commitment of Traders) for February 21, fewer long and short positions were reported. It should be clear that these data are of no interest at the moment because, amid the CFTC cyberattack, statistics are only now starting to catch up, making the data from one month ago less useful. I'll hold off till new reports are released and rely on more recent data. Inflation in the US is one of the significant events this week, and it could finally increase traders' confidence that the Fed and Jerome Powell won't resume their tough stance, as was stated last week. The possibility of the US banking industry collapsing (a risk that emerged with the BSV bankruptcy) will undoubtedly change Fed policymakers' assessments of how much more they need to raise interest rates to "finish off" the economy. According to the COT data, the number of long non-commercial positions fell by 160 to reach 236,414 while the number of short non-commercial roles fell by 1,322 to reach 71,346. The total non-commercial net position rose to 165,038 from 150,509 after the week. The weekly closing price fell from 1.0742 to 1.0698.
This image is no longer relevant

Signals from indicators

Moving Averages

The fact that trading is taking place above the 30 and 50-day moving averages suggests that the market is attempting to change course.

Notably, the author considers the time and prices of moving averages on the hourly chart H1 and departs from the standard definition of the traditional daily moving averages on the daily chart D1.

Bands by Bollinger

The indicator's upper limit, which is located around 1.0664, will serve as resistance in the event of growth.

Description of indicators

  • Moving average (moving average determines the current trend by smoothing out volatility and noise). Period 50. The graph is marked in yellow.
  • Moving average (moving average determines the current trend by smoothing out volatility and noise). Period 30. The graph is marked in green.
  • MACD indicator (Moving Average Convergence / Divergence - moving average convergence/divergence) Fast EMA period 12. Slow EMA period 26. SMA period 9
  • Bollinger Bands (Bollinger Bands). Period 20
  • Non-profit speculative traders, such as individual traders, hedge funds, and large institutions use the futures market for speculative purposes and to meet certain requirements.
  • Long non-commercial positions represent the total long open position of non-commercial traders.
  • Short non-commercial positions represent the total short open position of non-commercial traders.
  • Total non-commercial net position is the difference between the short and long positions of non-commercial traders.
เลือกช่วงเวลา
5
นาที
15
นาที
30
นาที
1
ชั่วโมง
4
ชั่วโมง
1
วัน
1
สัปดาห์
รับผลกำไรจากการเปลี่ยนแปลงอัตราสกุลเงินดิจิทัลกับ InstaForex.
ดาวน์โหลด MetaTrader 4 และเปิดการซื้อขายครั้งแรกของคุณ.
  • Grand Choice
    Contest by
    InstaForex
    InstaForex always strives to help you
    fulfill your biggest dreams.
    เข้าร่วมการแข่งขัน


บทความแนะนำ

คำแนะนำและการวิเคราะห์การซื้อขายสำหรับ GBP/USD เมื่อวันที่ 22 พฤษภาคม: เงินปอนด์ทะลุผ่านระดับสำคัญ

คู่สกุลเงิน GBP/USD เริ่มเคลื่อนไหวขึ้นอีกครั้งในวันพุธ การขึ้นของเงินปอนด์ซึ่งสะท้อนถึงการตกของเงินดอลลาร์สหรัฐนั้น เริ่มต้นขึ้นชั่วข้ามคืน ก่อนที่จะมีการเปิดเผยรายงานอัตราเงินเฟ้อของอังกฤษ ซึ่งอาจสร้างแรงกระตุ้นให้เงินปอนด์พุ่งขึ้นได้ อัตราเงินเฟ้อในอังกฤษไม่เพียงแค่เพิ่มขึ้น แต่พุ่งสูงเกินกว่าการคาดการณ์ ดังนั้นมีความเป็นไปได้ที่ธนาคารกลางอังกฤษอาจดำเนินการลดอัตราดอกเบี้ยในเดือนพฤษภาคมอย่างรวดเร็วเกินไป อย่างไรก็ตาม สิ่งที่สำคัญกว่าคือการผ่อนคลายทางการเงินรอบต่อไปจาก BoE อาจไม่เกิดขึ้นในปีนี้ ในขณะเดียวกัน

Paolo Greco 03:30 2025-05-22 UTC+2

การวิเคราะห์และคำแนะนำการเทรดสำหรับ EUR/USD ในวันที่ 22 พฤษภาคม: เหตุผลไม่สำคัญและไม่จำเป็น

คู่สกุลเงิน EUR/USD กลับมาเคลื่อนไหวในทิศทางขาขึ้นอีกครั้งในวันพุธ ซึ่งตอนนี้สามารถพูดได้อย่างปลอดภัยว่าการเคลื่อนไหวในแนวโน้มขาขึ้นไม่เพียงแต่ปรากฏในกรอบเวลารายชั่วโมงเท่านั้น แต่ยังปรากฏในกรอบเวลาที่สูงกว่าด้วย โดยเฉพาะอย่างยิ่งกรอบเวลา 4 ชั่วโมงและรายวันที่บ่งบอกถึงการกลับมาของแนวโน้มในสมัยของ "โดนัลด์ ทรัมป์" ในวันจันทร์ เราได้กล่าวว่า ตลาดใช้เหตุผลที่เป็นทางการเพื่อกลับมาขายดอลลาร์สหรัฐอีกครั้ง ในวันอังคาร ไม่มีเหตุผลใดเลยที่จะขายดอลลาร์

Paolo Greco 03:30 2025-05-22 UTC+2

วิธีการเทรดคู่สกุลเงิน GBP/USD ในวันที่ 21 พฤษภาคม? เคล็ดลับและการวิเคราะห์การเทรดอย่างง่ายสำหรับผู้เริ่มต้น

คู่สกุลเงิน GBP/USD มีการซื้อขายส่วนใหญ่แบบไซด์เวย์ในวันอังคาร แต่ช่วงเช้าวันพุธปรับตัวพุ่งขึ้น ในกรอบเวลา 4 ชั่วโมงชัดเจนว่าราคายังอยู่ในช่องแนวนอนที่ 1.3203–1.3440 และกำลังเข้าใกล้ขอบเขตบน อย่างไรก็ตาม การขึ้นอย่างรวดเร็วของค่าเงินปอนด์ ซึ่งโดยหลักแสดงถึงการลดลงอีกครั้งของดอลลาร์สหรัฐ แสดงถึงแนวโน้มขาขึ้นที่อาจจะกลับมาอีกครั้งที่เริ่มตั้งแต่เมื่อทรัมป์เข้ารับตำแหน่งในสหรัฐ ในเดือนที่ผ่านมา ดอลลาร์สหรัฐมีการปรับแก้ไขเพียงเล็กน้อย

Paolo Greco 06:17 2025-05-21 UTC+2

วิธีการเทรดคู่สกุลเงิน EUR/USD ในวันที่ 21 พฤษภาคม? เคล็ดลับและการวิเคราะห์การเทรดที่เข้าใจง่ายสำหรับผู้เริ่มต้น

เมื่อวันอังคาร คู่สกุลเงิน EUR/USD มีการซื้อขายด้านข้าง แต่กลับมามีการเคลื่อนไหวขึ้นอีกครั้งในเช้าวันพุธ การเคลื่อนไหวนี้บ่งชี้ว่าแนวโน้มขาขึ้นที่กำลังดำเนินอยู่ยังคงต่อเนื่อง ซึ่งตอนนี้ยาวนานไปถึงเดือนที่สี่แล้ว และได้รับแรงขับเคลื่อนจากนโยบายการค้าฉบับใหม่ของ Donald Trump เพียงอย่างเดียว ตลาดยังทำการหยุดชั่วคราวหนึ่งเดือนเพื่อแก้ไขปัญหาค่าเงินดอลลาร์ให้มากที่สุดเท่าที่จะเป็นไปได้ และตอนนี้ดูเหมือนว่าจะพร้อมที่จะเริ่มขายสกุลเงินสหรัฐฯ อีกครั้งด้วยแรงผลักดันใหม่ ในวันจันทร์

Paolo Greco 06:17 2025-05-21 UTC+2

คำแนะนำและการวิเคราะห์การซื้อขายสำหรับ GBP/USD ในวันที่ 21 พฤษภาคม: เงินปอนด์อังกฤษยังคงอยู่ในกรอบแคบ

คู่สกุลเงิน GBP/USD ยังคงซื้อขายอยู่ในกรอบของช่องทางด้านข้างในวันอังคาร ซึ่งมีมานานกว่าหนึ่งเดือนและสามารถมองเห็นได้อย่างชัดเจน ในขณะที่วันจันทร์ตลาดมีเหตุผลบางอย่างในการเคลื่อนไหวตามแนวโน้มระหว่างวัน อย่างไรก็ตามในวันอังคารไม่มีเหตุผลเช่นนั้นเลย เป็นผลให้ทั้งวันเป็นการเคลื่อนไหวด้านข้างเท่านั้น ไม่มีอะไรให้วิเคราะห์จากมุมมองด้านพื้นฐานหรือเศรษฐศาสตร์มหภาค จากมุมมองทางเทคนิค การเคลื่อนไหวด้านข้างยังคงมีอยู่และไม่มีอะไรจะเพิ่มขึ้นอีก เส้นของเครื่องมือ Ichimoku มีความสำคัญน้อยภายในช่องทางด้านข้างนี้ แม้ว่าพวกเขาจะสามารถสร้างสัญญาณที่ดีในบางกรณี แต่ส่วนใหญ่จะเป็นสัญญาณลวง

Paolo Greco 03:48 2025-05-21 UTC+2

คำแนะนำและการวิเคราะห์การเทรดสำหรับ EUR/USD วันที่ 21 พฤษภาคม: ยูโรยังคงปรับตัวสูงขึ้น

ในวันอังคารที่ผ่านมา คู่สกุลเงิน EUR/USD ส่วนใหญ่เคลื่อนไหวในลักษณะผันผวนแต่ไม่ค่อยมีทิศทางที่ชัดเจน แตกต่างจากวันจันทร์ที่ผ่านมาที่เทรดเดอร์ไม่มีเหตผลอย่างเป็นทางการในการขายดอลลาร์ ซึ่งเป็นสิ่งที่พวกเขาทำบ่อยในช่วงนี้. เป็นการย้ำเตือนว่าเมื่อวันจันทร์ การลดลงของ USD ได้รับแรงผลักดันจากข่าวลดอันดับเครดิตของสหรัฐและการเพิ่มการซื้อพันธบัตรรัฐบาลของธนาคารกลางสหรัฐ (Federal Reserve). เหล่านี้เป็นเหตุผลที่ค่อนข้างเป็นทางการ แต่ตลาดในปัจจุบันคว้าโอกาสใด

Paolo Greco 03:48 2025-05-21 UTC+2

วิธีการเทรดคู่เงิน GBP/USD ในวันที่ 20 พฤษภาคม? เคล็ดลับง่าย ๆ และการวิเคราะห์การเทรดสำหรับผู้เริ่มต้น

ตลอดวันจันทร์ คู่สกุลเงิน GBP/USD มีการเคลื่อนไหวขึ้นต่อเนื่อง และเมื่อดูผ่านๆ อาจจะเห็นว่ามีแนวโน้มขาขึ้นใหม่เกิดขึ้นในกราฟรายชั่วโมง โดยหลักการแล้วนี่คือความจริง เนื่องจากมีการเบรกทะลุเส้นแนวโน้มเก่าและเกิดเส้นแนวโน้มใหม่ อย่างไรก็ตาม หากคุณซูมออกหรือสลับไปที่กราฟที่มีกรอบเวลายาวขึ้น จะเห็นได้ว่าคู่นี้อยู่ในช่วงเคลื่อนไหวนิ่งมานานกว่าหนึ่งเดือน มีเพียงครั้งเดียวที่ราคาหลุดออกจากกรอบด้านข้างที่ 1.3203–1.3440 และนั่นก็เพียงช่วงสั้นๆ เท่านั้น

Paolo Greco 05:40 2025-05-20 UTC+2

วิธีการเทรดคู่สกุลเงิน EUR/USD ในวันที่ 20 พฤษภาคม? เคล็ดลับง่าย ๆ และการวิเคราะห์การเทรดสำหรับผู้เริ่มต้น

คู่สกุลเงิน EUR/USD พุ่งขึ้นด้วยพลังที่สดใหม่ในวันจันทร์ แต่สิ่งใดที่ทำให้เกิดการเคลื่อนไหวนี้ขึ้น ในเมื่อพื้นฐานทางเศรษฐกิจมหภาคและปัจจัยพื้นฐานในวันจันทร์แทบไม่มีเลย? ใช่แล้ว การประมาณการอัตราเงินเฟ้อครั้งที่สองของยูโรโซนได้ถูกเผยแพร่...แต่ไม่มีความแตกต่างจากครั้งแรก อย่างไรก็ตาม มันไม่ส่งผลต่อการดำเนินนโยบายการเงินของธนาคารกลางยุโรปอีกต่อไป เนื่องจาก ECB ได้ปรับลดอัตราดอกเบี้ยไปแล้วเจ็ดครั้งและกำลังเตรียมสำหรับครั้งที่แปด ไม่ว่าอย่างไร การผ่อนคลายทางการเงินซึ่งอาจนำไปสู่การลดลงของอัตราเงินเฟ้อนั้นเป็นปัจจัยทางขาลงสำหรับเงินยูโร แต่เงินยูโรกลับเพิ่มขึ้นตลอดทั้งวันจันทร์

Paolo Greco 05:40 2025-05-20 UTC+2

คำแนะนำการซื้อขายและการวิเคราะห์สำหรับ GBP/USD ในวันที่ 20 พฤษภาคม: เงินปอนด์ยังคงคว้าโอกาสทุกครั้งที่มี

คู่สกุลเงิน GBP/USD ยังคงเคลื่อนไหวขึ้นในวันจันทร์ ซึ่งเริ่มขึ้นตั้งแต่สัปดาห์ที่ผ่านมา ราคาสามารถทะลุผ่านทั้งสองเส้นของตัวบ่งชี้ Ichimoku ได้อย่างสำเร็จ ดังนั้นจากมุมมองทางเทคนิค แนวโน้มในกรอบเวลาชั่วโมงได้เปลี่ยนเป็นขาขึ้น อย่างไรก็ตาม เราต้องการให้ความสนใจกับนักเทรดในกรอบเวลาที่สูงขึ้นซึ่งจะเห็นได้ว่าการเคลื่อนไหวโดยรวมยังคงเป็นแบบแนวขวาง การพุ่งสูงขึ้นในวันจันทร์เป็นเพียงอีกหนึ่งการเคลื่อนไหวขึ้นในช่วงขอบเขตที่แบนราบนี้ มันเกิดขึ้นจากข่าวการลดอันดับเครดิตของสหรัฐฯ ซึ่งเราไม่ได้มองว่าเป็นเรื่องที่สำคัญมากนัก แต่ตลาดมีความเห็นต่าง

Paolo Greco 04:09 2025-05-20 UTC+2

คำแนะนำและการวิเคราะห์การเทรดสำหรับ EUR/USD เมื่อวันที่ 20 พฤษภาคม: ดอลลาร์กำลังมองหาสาเหตุที่จะลดลง

คู่สกุลเงิน EUR/USD แสดงการปรับตัวเพิ่มขึ้นอย่างชัดเจนในวันจันทร์ เราเชื่อว่าไม่มีเหตุผลทางเศรษฐกิจมหภาคหรือพื้นฐานที่จะอธิบายถึงการลดลงของดอลลาร์สหรัฐที่เกิดขึ้นในวันนั้น อย่างไรก็ตาม ตามที่ได้กล่าวไว้ก่อนหน้านี้ ตลาดไม่จำเป็นต้องมีเหตุผลที่เข้มแข็งในการขายดอลลาร์อีกต่อไป ดอลลาร์ถูกขายออกไปอย่างง่ายดายและมั่นใจ ต่างจากยูโรที่ยังคงไม่สามารถภูมิใจในเศรษฐกิจที่แข็งแกร่งหรือในนโยบายการเงินแบบเหยี่ยวของ ECB อย่างไรก็ตาม ปัจจัยเหล่านี้ทั้งหมดไม่มีความสำคัญในขณะนี้ ปัจจัยใดๆ ยกเว้นสงครามการค้าไม่มีผลกระทบต่อดอลลาร์เลย บางครั้งดอลลาร์อาจมีค่าเพิ่มขึ้น

Paolo Greco 04:09 2025-05-20 UTC+2
หากไม่สะดวกคุยในตอนนี้
ระบุคำถามไว้ได้ใน แชท.
Widget callback
 

Dear visitor,

Your IP address shows that you are currently located in the USA. If you are a resident of the United States, you are prohibited from using the services of InstaFintech Group including online trading, online transfers, deposit/withdrawal of funds, etc.

If you think you are seeing this message by mistake and your location is not the US, kindly proceed to the website. Otherwise, you must leave the website in order to comply with government restrictions.

Why does your IP address show your location as the USA?

  • - you are using a VPN provided by a hosting company based in the United States;
  • - your IP does not have proper WHOIS records;
  • - an error occurred in the WHOIS geolocation database.

Please confirm whether you are a US resident or not by clicking the relevant button below. If you choose the wrong option, being a US resident, you will not be able to open an account with InstaForex anyway.

We are sorry for any inconvenience caused by this message.