

was formed on 22.09 at 07:46:31 (UTC+0)
signal strength 3 of 5
signal strength 3 of 5
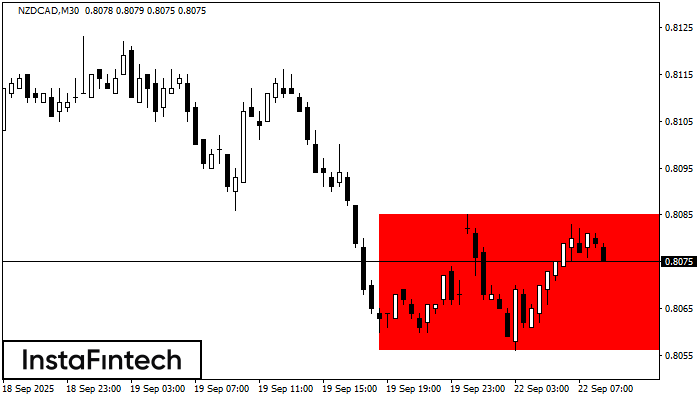
According to the chart of M30, NZDCAD formed the Bearish Rectangle. The pattern indicates a trend continuation. The upper border is 0.8085, the lower border is 0.8056. The signal means that a short position should be opened after fixing a price below the lower border 0.8056 of the Bearish Rectangle.
Figure
Instrument
Timeframe
Trend
Signal Strength


