empty
02.05.2025 06:31 AM
How to Trade the EUR/USD Pair on May 2? Simple Tips and Trade Analysis for Beginners

Analysis of Thursday's Trades

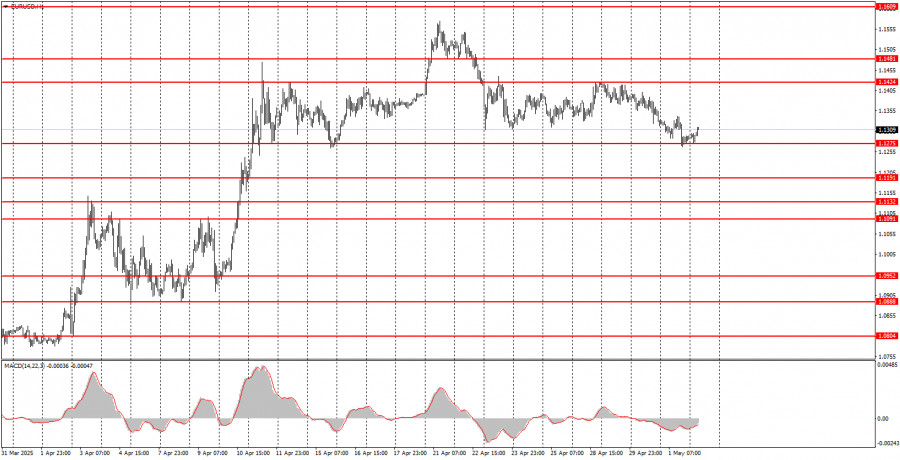
1H Chart of EUR/USD

This image is no longer relevant

On Thursday, the EUR/USD currency pair continued its downward movement and reached the 1.1275 level by the end of the day, which serves as the lower boundary of the sideways channel the pair has been trading within for more than three weeks. We've zoomed out the chart specifically to highlight this range. It's important to note that the brief breakout above this channel at the beginning of last week was anomalous and is not considered in the analysis.

Thus, the dollar's three-day rally appears baseless. Donald Trump has neither lifted nor reduced any tariffs, no hawkish news from the Federal Reserve, and nearly all U.S. macroeconomic data this week has been a disappointment. Therefore, we are inclined to interpret this movement as a purely technical retracement within the flat. A bounce from 1.1275 could trigger a rise toward 1.1424, the upper boundary of the range. Only a confirmed breakout below 1.1275 would suggest that the market has priced in the dollar's decline and no longer expects a fresh escalation in Trump's trade war.

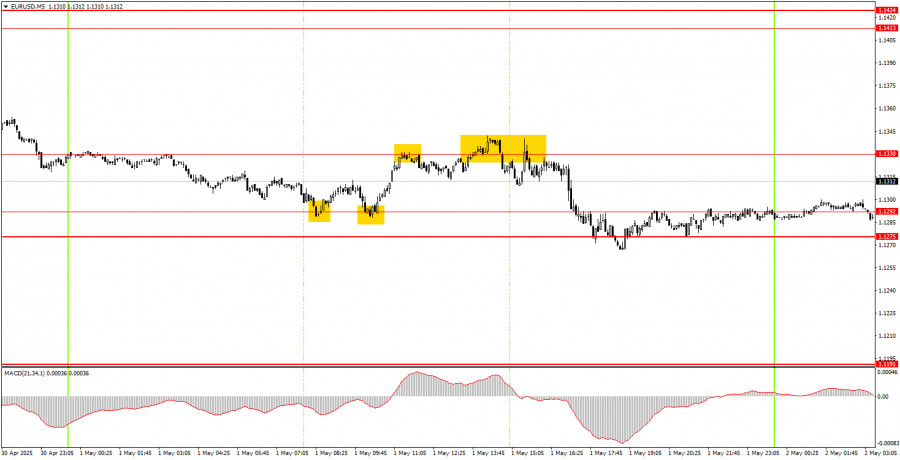
5M Chart of EUR/USD

This image is no longer relevant

On Thursday, several trading signals were formed in the 5-minute timeframe, as shown in the illustration above. Volatility was weak, so the quality of these signals was not very high. Some small gains could have been made, but overall, the market remains choppy, and the flat on the hourly chart persists.

Trading Strategy for Friday:

On the hourly timeframe, EUR/USD maintains a bullish bias, but excluding last week's volatility, the pair has been flat near highs for the past three weeks. The market remains highly bearish on the dollar and broadly negative on all things American, but should Trump initiate a de-escalation of the trade conflict he started, the dollar may regain some strength. When or if that happens, however, is unknown.

On Friday, the pair could move in either direction again, as market behavior is still largely dictated by Trump's statements and decisions. We believe the flat will continue for now. A bounce from the lower boundary (1.1275) could lead to upward movement.

On the 5-minute timeframe, the following levels should be considered: 1.0940–1.0952, 1.1011, 1.1091, 1.1132–1.1140, 1.1189–1.1191, 1.1275–1.1292, 1.1330, 1.1413–1.1424, 1.1474–1.1481, 1.1513, 1.1548, 1.1571, 1.1607–1.1622, 1.1666, 1.1689. The Eurozone will release its inflation report on Friday, but this will only be the second estimate for April, which typically draws little market attention. Far more important data will be released in the second half of the day—namely, the U.S. NonFarm Payrolls and unemployment rate. However, the market may easily overlook even these reports.

Core Trading System Rules:

  1. Signal Strength: The shorter the time it takes for a signal to form (a rebound or breakout), the stronger the signal.
  2. False Signals: If two or more trades near a level result in false signals, subsequent signals from that level should be ignored.
  3. Flat Markets: In flat conditions, pairs may generate many false signals or none at all. It's better to stop trading at the first signs of a flat market.
  4. Trading Hours: Open trades between the start of the European session and the middle of the US session, then manually close all trades.
  5. MACD Signals: On the hourly timeframe, trade MACD signals only during periods of good volatility and a clear trend confirmed by trendlines or trend channels.
  6. Close Levels: If two levels are too close (5–20 pips apart), treat them as a support or resistance zone.
  7. Stop Loss: Set a Stop Loss to breakeven after the price moves 15 pips in the desired direction.

Key Chart Elements:

Support and Resistance Levels: These are target levels for opening or closing positions and can also serve as points for placing Take Profit orders.

Red Lines: Channels or trendlines indicating the current trend and the preferred direction for trading.

MACD Indicator (14,22,3): A histogram and signal line used as a supplementary source of trading signals.

Important Events and Reports: Found in the economic calendar, these can heavily influence price movements. Exercise caution or exit the market during their release to avoid sharp reversals.

Note for Beginner Forex Traders: Not every trade can be profitable. Developing a clear strategy and sound money management is key to long-term success in trading.

Seleccione el marco de tiempo
5
min
15
min
30
min
1
hora
4
horas
1
día
1
s.
Gana con los cambios en el valor de las criptomonedas con InstaForex.
Descarga MetaTrader 4 y abre tu primera operación.
  • Grand Choice
    Contest by
    InstaForex
    InstaForex always strives to help you
    fulfill your biggest dreams.
    UNIRSE AL CONCURSO

Recommended Stories

GBP/USD: plan para la sesión europea del 2 de junio. Informes COT (Commitment of Traders) (análisis de las operaciones de ayer). La libra no cesa en sus intentos de subir

GBP/USD: plan para la sesión europea del 2 de junio. Informes COT (Commitment of Traders) (análisis de las operaciones de ayer). La libra no cesa en sus intentos de subir

Miroslaw Bawulski 08:29 2025-06-02 UTC+2

EUR/USD: plan para la sesión europea del 2 de junio. Informes COT (Commitment of Traders) (análisis de las operaciones de ayer). El euro no se rinde

El pasado viernes se formaron varios puntos de entrada al mercado. Veamos el gráfico de 5 minutos y analicemos lo que ocurrió allí. En mi pronóstico matutino presté atención

Miroslaw Bawulski 08:29 2025-06-02 UTC+2

GBP/USD: plan para la sesión europea del 28 de mayo. Informes COT (análisis de las operaciones de ayer) La libra sigue perdiendo terreno

Ayer se formaron varios puntos de entrada al mercado. Veamos el gráfico de 5 minutos y analicemos lo que ocurrió. En mi pronóstico matutino, presté atención al nivel 1.3545

Miroslaw Bawulski 08:07 2025-05-28 UTC+2

EUR/USD: plan para la sesión europea del 28 de mayo. Informes COT (análisis de las operaciones de ayer) El euro continúa cayendo

Ayer se formaron varios puntos de entrada al mercado. Veamos el gráfico de 5 minutos y analicemos lo que ocurrió. En mi pronóstico matutino, presté atención al nivel 1.1374

Miroslaw Bawulski 08:07 2025-05-28 UTC+2

GBP/USD: plan para la sesión europea del 26 de mayo. Informes COT (análisis de las operaciones de ayer). La libra sigue al euro

Para abrir posiciones largas en el par GBP/USD se requiere: La libra esterlina continúa fortaleciéndose, y las recientes decisiones de EE. UU. en relación con los aranceles comerciales le están

Miroslaw Bawulski 11:07 2025-05-26 UTC+2

EUR/USD: plan para la sesión europea del 26 de mayo. Informes COT (análisis de las operaciones de ayer). El euro reacciona a la decisión de Trump

Para abrir posiciones largas en el par EUR/USD se requiere: Las noticias de que Trump pospuso la introducción de aranceles elevados a productos de la UE hasta

Miroslaw Bawulski 11:07 2025-05-26 UTC+2

Recomendaciones para operar y análisis de las operaciones con el par GBP/USD el 22 de mayo. La libra rompe niveles importantes.

El par de divisas GBP/USD también reanudó su movimiento ascendente el miércoles. El crecimiento de la libra esterlina, que en realidad sigue siendo una caída del dólar estadounidense, comenzó durante

Paolo Greco 07:12 2025-05-22 UTC+2

Recomendaciones para operar y análisis de las operaciones con el par EUR/USD el 22 de mayo. Las razones no importan ni son necesarias.

El par de divisas EUR/USD reanudó su movimiento ascendente durante el miércoles, y ahora se puede decir que existe una tendencia alcista no solo en el marco temporal

Paolo Greco 07:12 2025-05-22 UTC+2

GBP/USD: plan para la sesión europea del 9 de mayo. Informes COT (Commitment of Traders, análisis de las operaciones de ayer). La libra se desplomó tras la bajada de tasas

GBP/USD: plan para la sesión europea del 9 de mayo. Informes COT (Commitment of Traders, análisis de las operaciones de ayer). La libra se desplomó tras la bajada de tasas

Miroslaw Bawulski 07:46 2025-05-09 UTC+2

EUR/USD: plan para la sesión europea del 9 de mayo. Informes COT (Commitment of Traders, análisis de las operaciones de ayer). El euro vuelve a caer

Ayer se formaron varios puntos de entrada al mercado. Veamos el gráfico de 5 minutos y analicemos lo que ocurrió. En mi pronóstico matutino presté atención al nivel de 1.1269

Miroslaw Bawulski 07:46 2025-05-09 UTC+2
¿No puede hablar ahora mismo?
Ingrese su pregunta en el chat.
Widget callback
 

Dear visitor,

Your IP address shows that you are currently located in the USA. If you are a resident of the United States, you are prohibited from using the services of InstaFintech Group including online trading, online transfers, deposit/withdrawal of funds, etc.

If you think you are seeing this message by mistake and your location is not the US, kindly proceed to the website. Otherwise, you must leave the website in order to comply with government restrictions.

Why does your IP address show your location as the USA?

  • - you are using a VPN provided by a hosting company based in the United States;
  • - your IP does not have proper WHOIS records;
  • - an error occurred in the WHOIS geolocation database.

Please confirm whether you are a US resident or not by clicking the relevant button below. If you choose the wrong option, being a US resident, you will not be able to open an account with InstaForex anyway.

We are sorry for any inconvenience caused by this message.