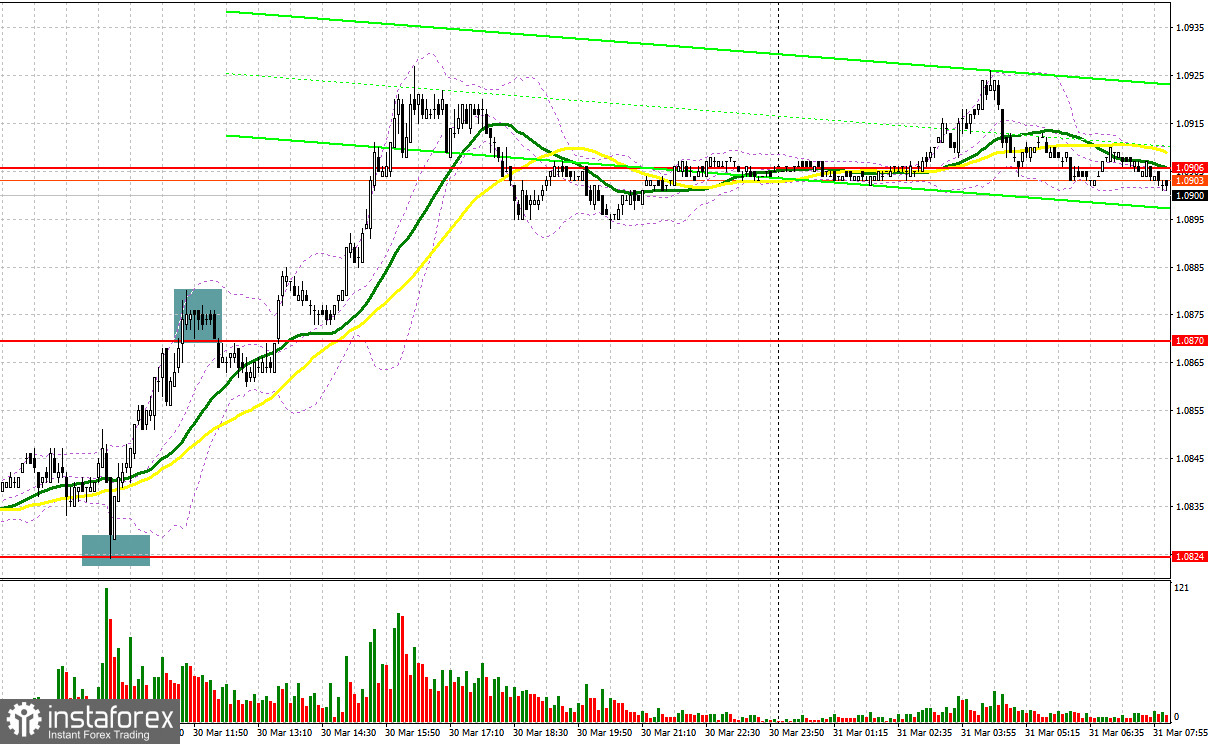
Yesterday, traders received several signals to enter the market. Let us take a look at the 5-minute chart to figure out what happened. Earlier, I asked you to pay attention to the level of 1.0824 to decide when to enter the market. A decline and a false breakout of this level led to a buy signal, which resulted in a 40-pip rise. A false breakout of 1.0879 gave a sell signal but the euro did not show a considerable decline. In the second part of the day, there were no signals to enter the market.
Conditions for opening long positions on EUR/USD:
This day is expected to be very rich in events. Today is the last trading day of the week and of the month. What is more, various countries will disclose a bulk of macroeconomic information whereas officials of global central banks will deliver speeches. If the first part of the day, volatility may jump just after the publication of reports on Germany's unemployment rate and the number of unemployed people. However, it is much more interesting what figures the eurozone inflation report may unveil. The fact is that the data is expected to boost the euro. Christine Lagarde's speech will be the cherry on the cake. In case of a negative reaction to the data, which is also possible, it is better to enter the market near the closest support level of 1.0872. Slightly above this level, there are bullish MAs. A false breakout of this level will give a good long signal with the target near the monthly high of 1.0923. Only a breakout and a downward test of this level will give an additional buy signal with the target at 1.0975, where traders should lock in profits. The farthest target is located near 1.1002 but the price will hardly hit this level. If the euro/dollar pair declines and buyers fail to protect 1.0872, which is more likely under the current conditions, pressure on the euro will increase. In this case, the asset may decline to 1.0825. Only a false breakout will give a buy signal. Traders may also go long just after a bounce off the low of 1.0787 or even lower – near 1.0748, expecting a rise of 30-35 pips within the day.
Conditions for opening short positions on EUR/USD:
Sellers once again failed to enter the market. Formation of the downward trend at the end of the week is their last chance. Now, they should primarily protect the monthly high of 1.0923. Only a false breakout of this level amid disappointing data will give a sell signal with the target at the nearest support level of 1.0872. A breakout and a reverse test of this level will seriously affect bulls and push the price to 1.0825. If the euro settles below this level, it may slide to 1.0787, thus reviving the downtrend. It is better to lock in profits at this level. If the euro/dollar pair increases during the European session and bears fail to protect 1.0923, which is really possible, it will be wise to avoid selling the asset until the price touches 1.0975. There, it is possible to sell only after an unsuccessful settlement. Traders may open sell orders just after a rebound from the high of 1.1002, expecting a decline of 30-35 pips.
COT report
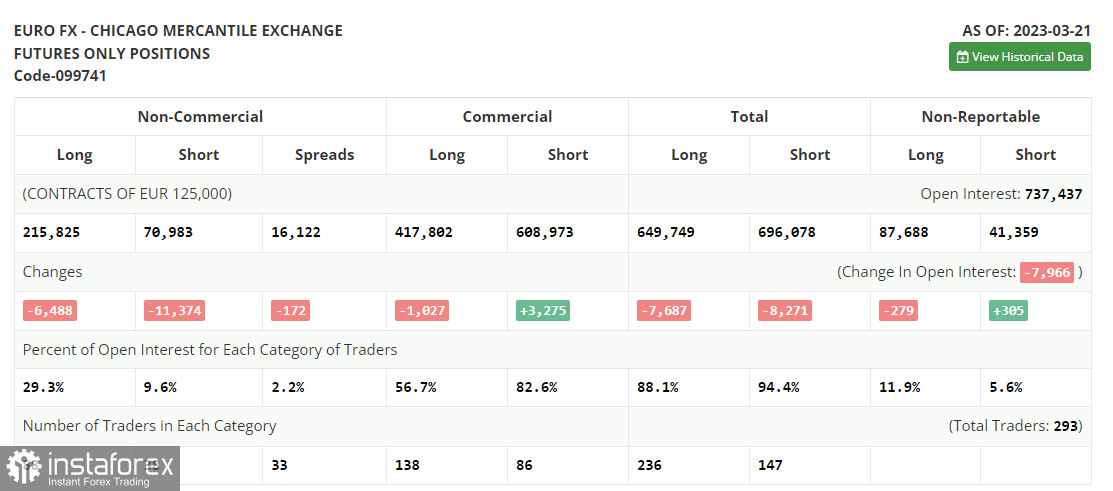
According to the COT report from March 21, the number of both long and short positions dropped. The Fed's meeting held in March affected the market situation. However, the US dollar is unlikely to slump since the regulator remained stuck to its policy. The aggressive approach of the ECB is the only fact that is supporting the euro at the moment. The central bank is planning to raise the key interest rate higher without altering its stance. Thus, the COT report unveiled that the number of long non-commercial positions decreased by 6,488 to 215,825, while the number of short non-commercial positions fell by 11,374 to 70,983. At the end of the week, the total non-commercial net position increased to 144,842 against 139,956. The weekly closing price rose to 1.0821 against 1.0803.
Signals of indicators:
Moving Averages
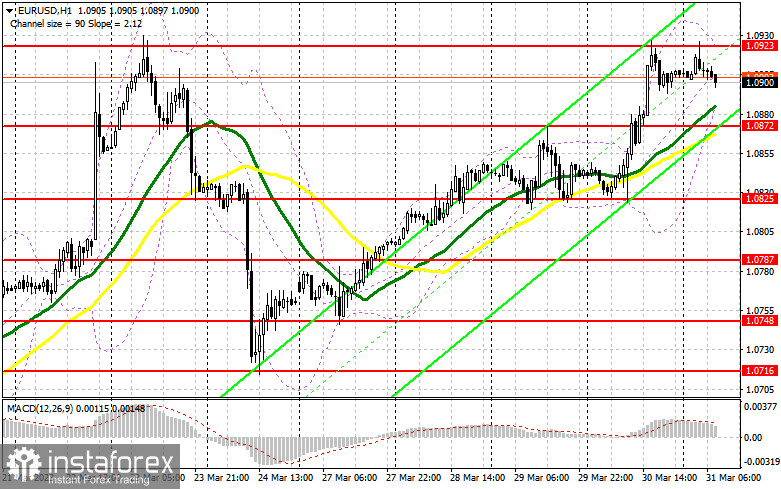
Trading is performed above the 30- and 50-day moving averages, which points to a further rise in the pair.
Note: The author considers the period and prices of moving averages on the one-hour chart which differs from the general definition of the classic daily moving averages on the daily chart.
Bollinger Bands
In case of a decline, the lower limit of the indicator located at 1.0875 will act as support.
Description of indicators
- Moving average (a moving average determines the current trend by smoothing volatility and noise). The period is 50. It is marked in yellow on the chart.
- Moving average (a moving average determines the current trend by smoothing volatility and noise). The period is 30. It is marked in green on the graph.
- MACD indicator (Moving Average Convergence/Divergence - convergence/divergence of moving averages). A fast EMA period is 12. A slow EMA period is 26. The SMA period is 9.
- Bollinger Bands. The period is 20.
- Non-profit speculative traders are individual traders, hedge funds, and large institutions that use the futures market for speculative purposes and meet certain requirements.
- Long non-commercial positions are the total number of long positions opened by non-commercial traders.
- Short non-commercial positions are the total number of short positions opened by non-commercial traders.
- The total non-commercial net position is a difference in the number of short and long positions opened by non-commercial traders.