signal strength 1 of 5
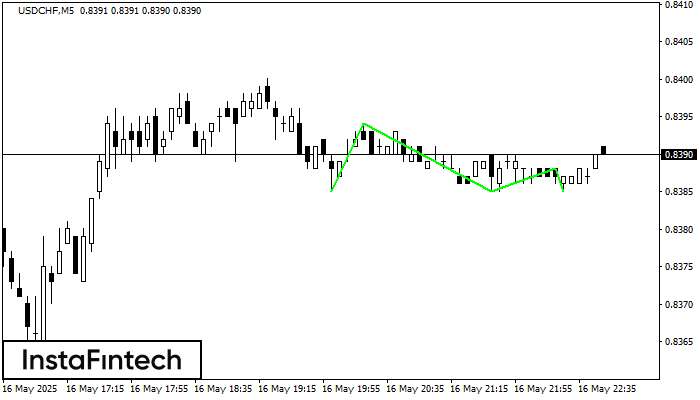
The Triple Bottom pattern has been formed on USDCHF M5. It has the following characteristics: resistance level 0.8394/0.8388; support level 0.8385/0.8385; the width is 9 points. In the event of a breakdown of the resistance level of 0.8394, the price is likely to continue an upward movement at least to 0.8400.
The M5 and M15 time frames may have more false entry points.
- All
- Double Top
- Flag
- Head and Shoulders
- Pennant
- Rectangle
- Triangle
- Triple top
- All
- #AAPL
- #AMZN
- #Bitcoin
- #EBAY
- #FB
- #GOOG
- #INTC
- #KO
- #MA
- #MCD
- #MSFT
- #NTDOY
- #PEP
- #TSLA
- #TWTR
- AUDCAD
- AUDCHF
- AUDJPY
- AUDUSD
- EURCAD
- EURCHF
- EURGBP
- EURJPY
- EURNZD
- EURRUB
- EURUSD
- GBPAUD
- GBPCHF
- GBPJPY
- GBPUSD
- GOLD
- NZDCAD
- NZDCHF
- NZDJPY
- NZDUSD
- SILVER
- USDCAD
- USDCHF
- USDJPY
- USDRUB
- All
- M5
- M15
- M30
- H1
- D1
- All
- Buy
- Sale
- All
- 1
- 2
- 3
- 4
- 5
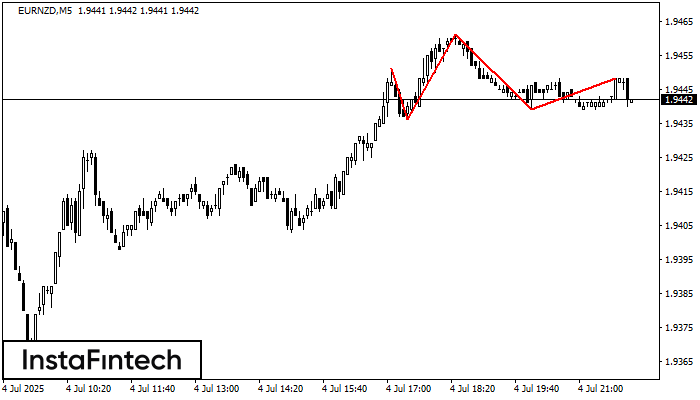
According to the chart of M5, EURNZD formed the Head and Shoulders pattern. The Head’s top is set at 1.9461 while the median line of the Neck is found
The M5 and M15 time frames may have more false entry points.
Open chart in a new window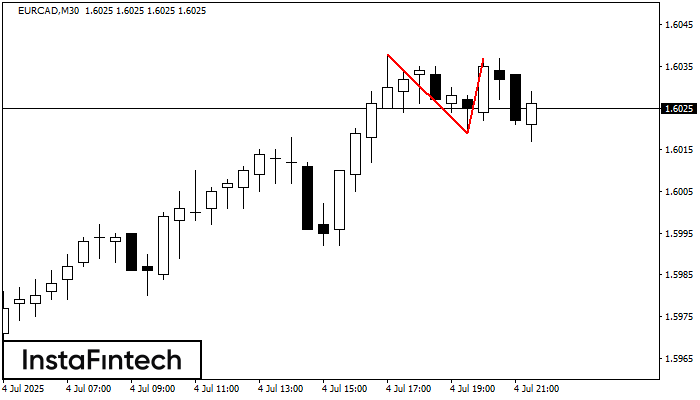
The Double Top pattern has been formed on EURCAD M30. It signals that the trend has been changed from upwards to downwards. Probably, if the base of the pattern 1.6019
Open chart in a new window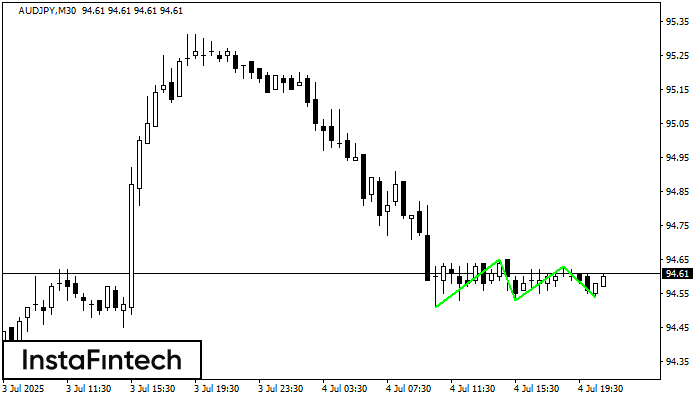
The Triple Bottom pattern has formed on the chart of AUDJPY M30. Features of the pattern: The lower line of the pattern has coordinates 94.65 with the upper limit 94.65/94.63
Open chart in a new window