signal strength 2 of 5
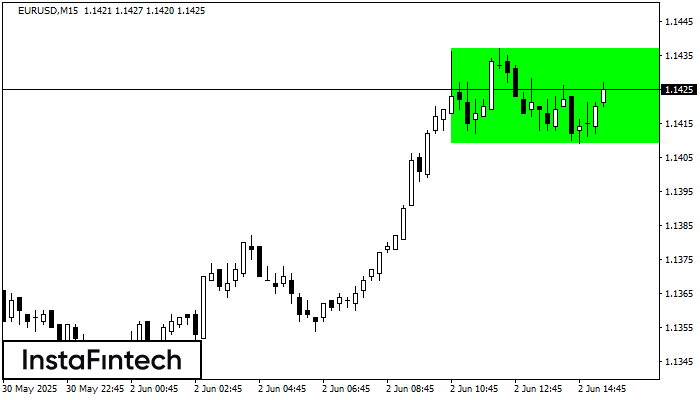
According to the chart of M15, EURUSD formed the Bullish Rectangle which is a pattern of a trend continuation. The pattern is contained within the following borders: the lower border 1.1409 – 1.1409 and upper border 1.1437 – 1.1437. In case the upper border is broken, the instrument is likely to follow the upward trend.
The M5 and M15 time frames may have more false entry points.
- All
- Double Top
- Flag
- Head and Shoulders
- Pennant
- Rectangle
- Triangle
- Triple top
- All
- #AAPL
- #AMZN
- #Bitcoin
- #EBAY
- #FB
- #GOOG
- #INTC
- #KO
- #MA
- #MCD
- #MSFT
- #NTDOY
- #PEP
- #TSLA
- #TWTR
- AUDCAD
- AUDCHF
- AUDJPY
- AUDUSD
- EURCAD
- EURCHF
- EURGBP
- EURJPY
- EURNZD
- EURRUB
- EURUSD
- GBPAUD
- GBPCHF
- GBPJPY
- GBPUSD
- GOLD
- NZDCAD
- NZDCHF
- NZDJPY
- NZDUSD
- SILVER
- USDCAD
- USDCHF
- USDJPY
- USDRUB
- All
- M5
- M15
- M30
- H1
- D1
- All
- Buy
- Sale
- All
- 1
- 2
- 3
- 4
- 5
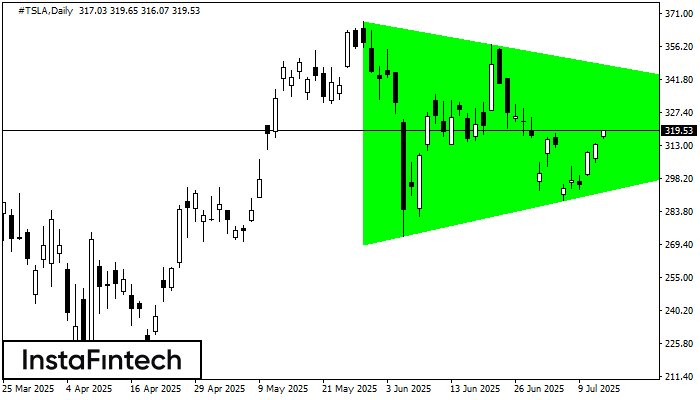
По #TSLA на D1 фигура «Бычий симметричный треугольник». Характеристика: Фигура продолжения тренда; Координаты границ – верхняя 367.40, нижняя 269.16. Проекция ширины фигуры 9824 пунктов. Прогноз: В случае пробоя верхней границы
Открыть график инструмента в новом окне
По #TSLA на D1 сформировалась фигура «Бычий симметричный треугольник». Нижняя граница фигуры имеет координаты 269.16/323.26, при этом верхняя граница 367.40/323.26. Формирование фигуры «Бычий симметричный треугольник» наиболее вероятным образом свидетельствует
Открыть график инструмента в новом окне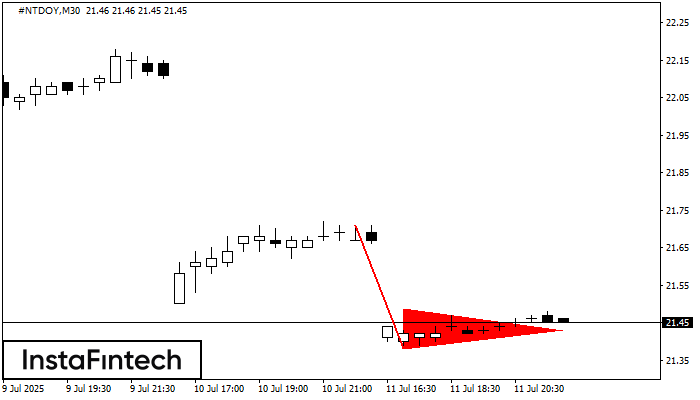
На графике #NTDOY M30 сформировалась фигура «Медвежий вымпел». Фигура сигнализирует о продолжении нисходящего тренда в случае пробоя минимума вымпела 21.38. Рекомендации: Отложенный ордер Sell Stop выставляется на 10 пунктов ниже
Открыть график инструмента в новом окне