Analyzing Tuesday's trades:
EUR/USD on 30M chart
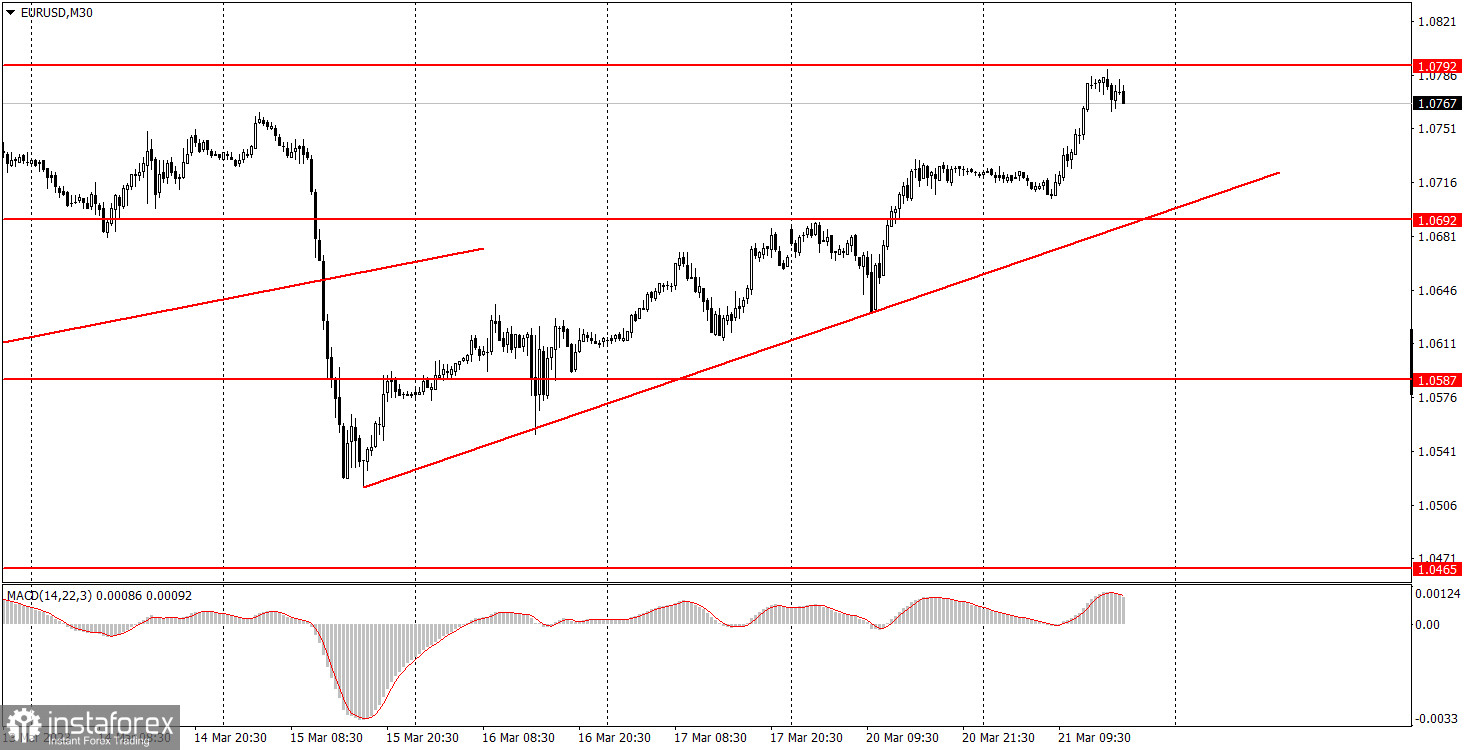
On Tuesday, EUR/USD continued a not too strong, but stable upward movement. Basically, it does not even make sense to ask why the euro rose today. Firstly, on the 30-minute chart we have an ascending trend line. Secondly, there are "swings" on the higher chart, which means that the pair may move in either direction without any fundamental reasons. Thirdly, there are some fundamental factors, which could support the euro. I will speak about them in detail in our fundamental articles. That is why the euro could and did show growth on Tuesday. The results of the Federal Reserve will be announced tomorrow, which can also influence the market mood. The only thing is that we do not know exactly what the market is expecting from the Fed. Judging by the fact that the dollar is falling, a pause in tightening of the monetary policy. In any case, until the quotes settle below the trend line, you can trade on the upward movement.
EUR/USD on 5M chart
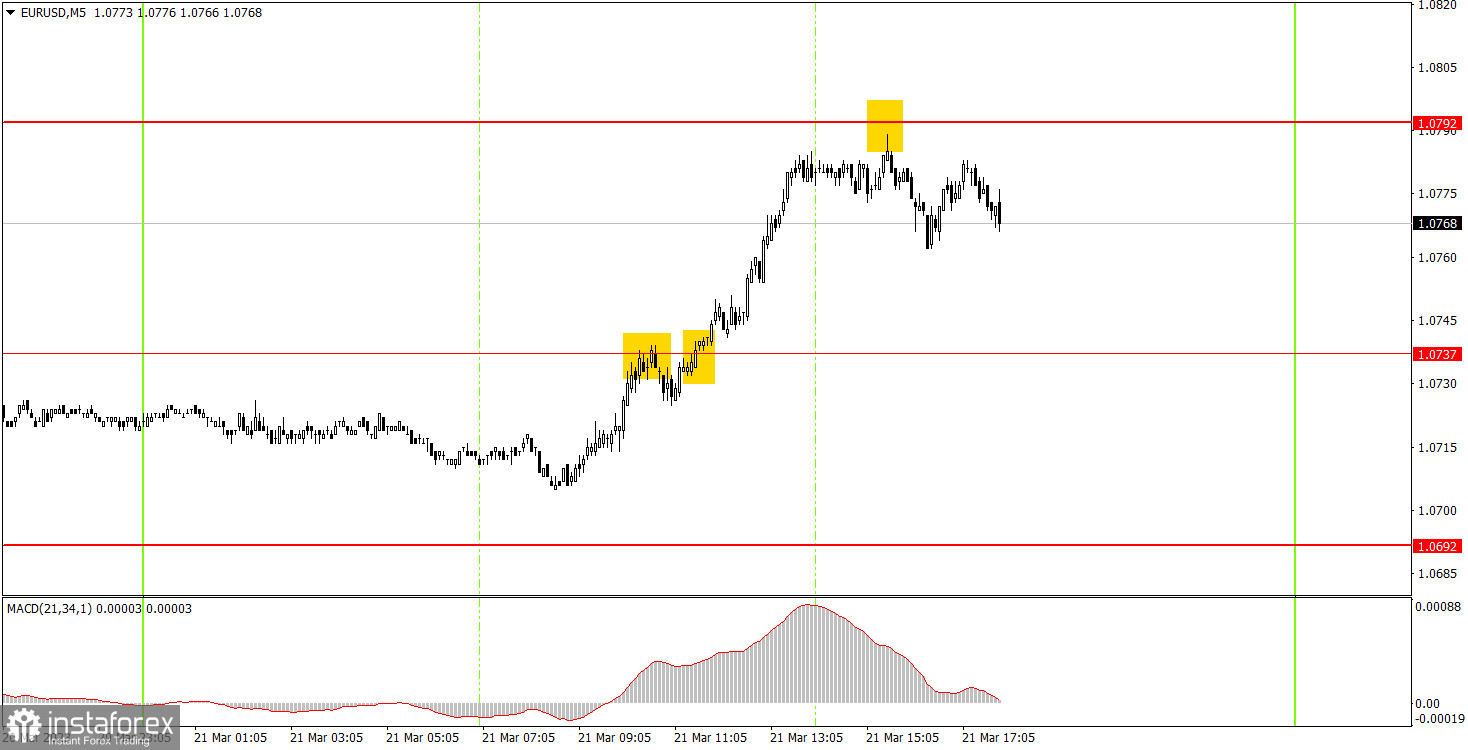
Several trading signals were formed on the 5-minute chart. Unfortunately, the pair only moved in one direction, but just during the formation of the first signal, the pair rolled back down literally 10 pips, which led to a false signal. In half an hour, the pair broke through 1.0737, and beginners had to change short positions for long ones. The longs managed to earn about 35 pips, since the price almost reached the target level of 1.0792 but fell short of 3 pips. You could close longs there and open short ones instead, which were also profitable, since the pair rolled back several tens of points till the evening. Thus, two profitable trades completely covered one unprofitable one and made it possible for beginners to earn at the end of the day. But the profit could be much more.
Trading tips on Wednesday:
On the 30-minute chart, the pair continues to form a new uptrend, as evidenced by the ascending trend line. Considering the swing, the pair can move in any direction regardless of the macroeconomic background, trend lines and "fundamentals". Consolidating below the trend line does not mean that a powerful downward movement will start now, but still it serves as a guide. On the 5-minute chart, it is recommended to trade at the levels 1.0433, 1.0465-1.0483, 1.0535, 1.0587-1.0607, 1.0692, 1.0737, 1.0792, 1.0857-1.0867, 1.0920-1.0933. As soon as the price passes 15 pips in the right direction, you should set a Stop Loss to breakeven. On Wednesday there will be another speech of ECB Chairman Christine Lagarde, but this time market participants will not focus on her but on the announcement of the results of the Fed meeting in the evening. There could be "surprises" and increased volatility. Before this event, beginners may leave the market.
Basic rules of the trading system:
1) The strength of the signal is determined by the time it took the signal to form (a rebound or a breakout of the level). The quicker it is formed, the stronger the signal is.
2) If two or more positions were opened near a certain level based on a false signal (which did not trigger a Take Profit or test the nearest target level), then all subsequent signals at this level should be ignored.
3) When trading flat, a pair can form multiple false signals or not form them at all. In any case, it is better to stop trading at the first sign of a flat movement.
4) Trades should be opened in the period between the start of the European session and the middle of the US trading hours when all positions must be closed manually.
5) You can trade using signals from the MACD indicator on the 30-minute time frame only amid strong volatility and a clear trend that should be confirmed by a trendline or a trend channel.
6) If two levels are located too close to each other (from 5 to 15 pips), they should be considered support and resistance levels.
On the chart:
Support and Resistance levels are the levels that serve as targets when buying or selling the pair. You can place Take Profit near these levels.
Red lines are channels or trend lines that display the current trend and show in which direction it is better to trade now.
The MACD indicator (14, 22, and 3) consists of a histogram and a signal line. When they cross, this is a signal to enter the market. It is recommended to use this indicator in combination with trend patterns (channels and trendlines).
Important announcements and economic reports that can be found on the economic calendar can seriously influence the trajectory of a currency pair. Therefore, at the time of their release, we recommend trading as carefully as possible or exiting the market in order to avoid sharp price fluctuations.
Beginners on Forex should remember that not every single trade has to be profitable. The development of a clear strategy and money management is the key to success in trading over a long period of time.