empty
31.03.2023 04:24 PM
Trading Signal for GOLD (XAU/USD) for March 31, 2023: sell below $1,979 (21 SMA - symmetrical triangle)

This image is no longer relevant

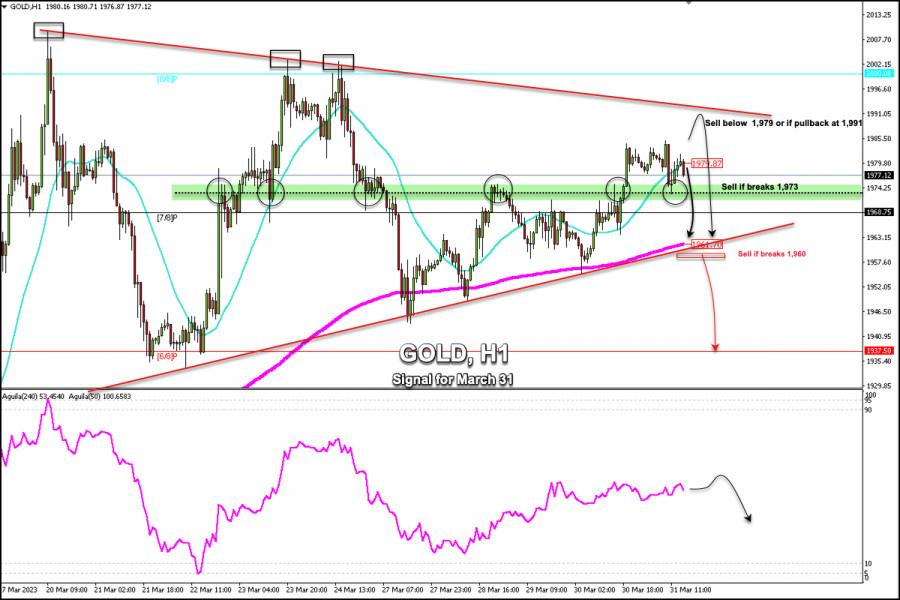
Early in the American session, Gold (XAU/USD) is trading around 1,977.12, below the 21 SMA, and above the 200 EMA. We can see that the bullish force still prevails but the price could be facing a resistance zone which could lead to a change in the trend.

According to the 1-hour chart, we can see that gold has a key resistance zone around 1,991. This level has been traced from the high of 2009, 2003, and 2002. In case gold approaches this resistance zone, we expect the signal to sell to be activated.

On the other hand, in case XAU/USD breaks the daily pivot point located at 1,973, we could expect the bearish movement to accelerate which will push the price to the 200 EMA located at 1,961.70.

In the chart above, we can observe a symmetrical triangle formation. The break below 1,960 could confirm a bearish movement in the short. In the medium term, the price could fall towards 1,937 (6/8 Murray) and to the psychological level of 1,900.

Conversely, if gold consolidates above 1,990, the bull cycle is likely to extend and the instrument could climb to 8/8 Murray at $2,000 and ultimately it could reach +1/8 Murray located at 2,031.

As long as gold trades above 1,970, there is a chance it will continue to rise and the price could move closer to the key level of 1,991. A pullback to this area could be seen as a signal to sell, with targets at 1,961 and 1,937.

Our trading plan for the next few hours is to sell below 1,979 (21 SMA). In case of a pullback to 1,991, we could continue selling with targets at 1,961 and 1,937 (6/8 Murray).

Dimitrios Zappas,
InstaForex के विश्लेषणात्मक विशेषज्ञ
© 2007-2025
समय सीमा चुनें
5
मिनट
15
मिनट
30
मिनट
1
घंटा
4
घंटे
1
दिन
1
सप्ताह
Earn on cryptocurrency rate changes with InstaForex
Download MetaTrader 4 and open your first trade
  • Grand Choice
    Contest by
    InstaForex
    InstaForex always strives to help you
    fulfill your biggest dreams.
    कॉन्टेस्ट में हिस्सा लें

अनुशंसित लेख

GBP/CAD क्रॉस करेंसी पेयर्स की दैनिक मूल्य चाल का तकनीकी विश्लेषण, मंगलवार 3 जून 2025

GBP/CAD क्रॉस करेंसी पेयर के 4-घंटे के चार्ट में जो देखा जा रहा है, उससे ऐसा प्रतीत होता है कि GBP/CAD की मूल्य चाल और स्टोकेस्टिक ऑस्सीलेटर इंडिकेटर के बीच

Arief Makmur 12:00 2025-06-03 UTC+2

3 जून 2025 के लिए GBP/USD का पूर्वानुमान

जोखिम बाजार के रुझानों के मजबूत होने और अमेरिकी डॉलर में 0.63% की गिरावट के बीच, ब्रिटिश पाउंड 93 पिप्स बढ़ गया। अब कीमत गंभीर रूप से 1.3635 स्तर को

Laurie Bailey 06:20 2025-06-03 UTC+2

3 जून 2025 के लिए USD/JPY का पूर्वानुमान

सोमवार को, येन ने MACD लाइन समर्थन और लक्ष्य स्तर 143.45 को मजबूती से तोड़ दिया, और 134 पिप्स की चाल बनाई। मार्लिन ऑस्सीलेटर मंदी वाले क्षेत्र में प्रवेश

Laurie Bailey 06:18 2025-06-03 UTC+2

30 मई, 2025 को GBP/USD का पूर्वानुमान

गुरुवार को ब्रिटिश पाउंड ने लक्ष्य समर्थन स्तर 1.3433 को छुआ, जिसके बाद यह ऊपर की ओर मुड़ा और दिन का समापन 20 पिप्स की बढ़त के साथ हुआ। मार्लिन

Laurie Bailey 07:10 2025-05-30 UTC+2

30 मई, 2025 को USD/JPY का पूर्वानुमान

जापानी येन ने कल एक महत्वपूर्ण चाल दिखाई, दिन के उच्च स्तर से बंद तक दो अंकों से अधिक गिरावट आई। येन की मजबूती की तेज लहर आज भी जारी

Laurie Bailey 07:07 2025-05-30 UTC+2

GBP/USD का पूर्वानुमान - 29 मई, 2025

तीन दिनों की गिरावट के बाद, ब्रिटिश पाउंड 1.3433 के लक्ष्य समर्थन स्तर पर पहुँच गया है। दैनिक चार्ट पर, मार्लिन ऑस्सीलेटर ने अभी तक अपने चढ़ते चैनल की निचली

Laurie Bailey 06:20 2025-05-29 UTC+2

AUD/USD Forecast for May 29, 2025

संयुक्त राज्य अमेरिका में आंतरिक राजनीतिक टकराव (एक अदालत के फैसले ने ट्रंप के ट्रेड टैरिफ को रद्द कर दिया) ने ऑस्ट्रेलियन डॉलर को 0.6394–0.6444 के दायरे में वापस ला

Laurie Bailey 06:06 2025-05-29 UTC+2

बुधवार, 28 मई 2025 को AUD/JPY क्रॉस करेंसी पेयर की इंट्राडे प्राइस मूवमेंट का तकनीकी विश्लेषण।

AUD/JPY मुद्रा जोड़ी की चाल और Stochastic Oscillator संकेतक के बीच अभिसरण (Convergence) दिखाई देने के साथ-साथ इसकी कीमत का WMA (21) के ऊपर होना और 4-घंटे के चार्ट में

Arief Makmur 12:49 2025-05-28 UTC+2

जीबीपी/एयूडी क्रॉस करेंसी पेयर्स की इंट्राडे मूल्य चाल का तकनीकी विश्लेषण, मंगलवार 27 मई, 2025।

अगर हम GBP/AUD क्रॉस करेंसी पेयर के 4-घंटे के चार्ट को देखें, तो यह प्रतीत होता है कि GBP/AUD की कीमत की चाल और स्टोकास्टिक ऑस्सीलेटर इंडिकेटर के बीच डाइवर्जेंस

Arief Makmur 11:43 2025-05-27 UTC+2

सोने के कमोडिटी इंस्ट्रूमेंट की इंट्राडे मूल्य चाल का तकनीकी विश्लेषण, मंगलवार 27 मई, 2025।

4-घंटे के चार्ट पर सोने की कीमतें WMA (21) के ऊपर एक बढ़ती हुई ढलान के साथ चल रही हैं, जिससे निकट भविष्य में सोना 3365.45 के स्तर तक पहुंचने

Arief Makmur 11:41 2025-05-27 UTC+2
अभी बात नहीं कर सकते?
अपना प्रश्न पूछें बातचीत.
Widget callback
 

Dear visitor,

Your IP address shows that you are currently located in the USA. If you are a resident of the United States, you are prohibited from using the services of InstaFintech Group including online trading, online transfers, deposit/withdrawal of funds, etc.

If you think you are seeing this message by mistake and your location is not the US, kindly proceed to the website. Otherwise, you must leave the website in order to comply with government restrictions.

Why does your IP address show your location as the USA?

  • - you are using a VPN provided by a hosting company based in the United States;
  • - your IP does not have proper WHOIS records;
  • - an error occurred in the WHOIS geolocation database.

Please confirm whether you are a US resident or not by clicking the relevant button below. If you choose the wrong option, being a US resident, you will not be able to open an account with InstaForex anyway.

We are sorry for any inconvenience caused by this message.