signal strength 4 of 5
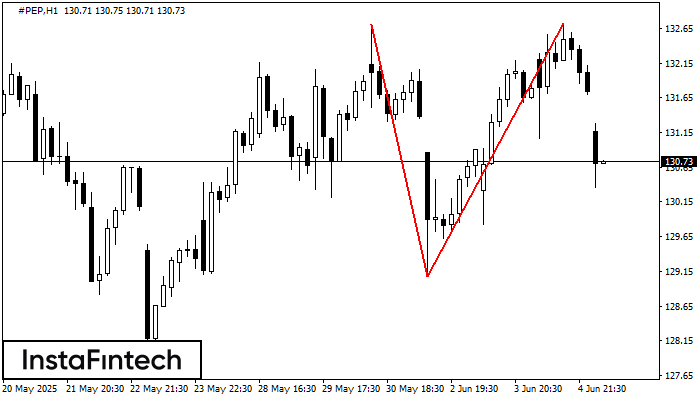
On the chart of #PEP H1 the Double Top reversal pattern has been formed. Characteristics: the upper boundary 132.72; the lower boundary 129.07; the width of the pattern 365 points. The signal: a break of the lower boundary will cause continuation of the downward trend targeting the 128.67 level.
See Also
- All
- Double Top
- Flag
- Head and Shoulders
- Pennant
- Rectangle
- Triangle
- Triple top
- All
- #AAPL
- #AMZN
- #Bitcoin
- #EBAY
- #FB
- #GOOG
- #INTC
- #KO
- #MA
- #MCD
- #MSFT
- #NTDOY
- #PEP
- #TSLA
- #TWTR
- AUDCAD
- AUDCHF
- AUDJPY
- AUDUSD
- EURCAD
- EURCHF
- EURGBP
- EURJPY
- EURNZD
- EURRUB
- EURUSD
- GBPAUD
- GBPCHF
- GBPJPY
- GBPUSD
- GOLD
- NZDCAD
- NZDCHF
- NZDJPY
- NZDUSD
- SILVER
- USDCAD
- USDCHF
- USDJPY
- USDRUB
- All
- M5
- M15
- M30
- H1
- D1
- All
- Buy
- Sale
- All
- 1
- 2
- 3
- 4
- 5
The Double Top reversal pattern has been formed on GBPJPY H1. Characteristics: the upper boundary 207.31; the lower boundary 206.85; the width of the pattern is 48 points. Sell trades
Открыть график инструмента в новом окнеAccording to the chart of H1, NZDCAD formed the Bullish Rectangle which is a pattern of a trend continuation. The pattern is contained within the following borders: the lower border
Открыть график инструмента в новом окнеAccording to the chart of M5, GBPUSD formed the Bullish Symmetrical Triangle pattern, which signals the trend will continue. Description. The upper border of the pattern touches the coordinates 1.3352/1.3335
The M5 and M15 time frames may have more false entry points.
Открыть график инструмента в новом окне


