EUR/USD 5-Minute Analysis
The EUR/USD currency pair traded very differently throughout Wednesday. During the European trading session, the pair continued its sideways movement, which had persisted for several days. There was no macroeconomic background then, and the market was unimpressed by Donald Trump's new statements about signing a trade deal with China. After all, everyone understands the falsehood of such claims. During the second meeting in London, China and the U.S. merely agreed to remove some minor disagreements regarding the export of critical goods and materials—nothing more. However, the market was deeply concerned by the mass unrest that could soon engulf all of America or at least all major cities. It's already known that protesters are preparing to resist the National Guard strongly, and Trump is even considering calling in the regular army "to suppress the uprising."
Thus, even on Wednesday, the dollar had enough reasons to resume its decline. But what impressed the market most was the inflation report. It was precisely after its release that the dollar resumed its fall. According to the report, the Consumer Price Index (CPI) in May remained at 2.8%, while forecasts expected 2.9%. Let's break it down: if inflation is rising or not falling, then the Federal Reserve is even less likely to resume a monetary easing cycle in the near future. However, the market had expected an increase in the figure, and the 2.8% result was unsatisfactory. Based on this rather formal rationale, the dollar continued to be sold off.
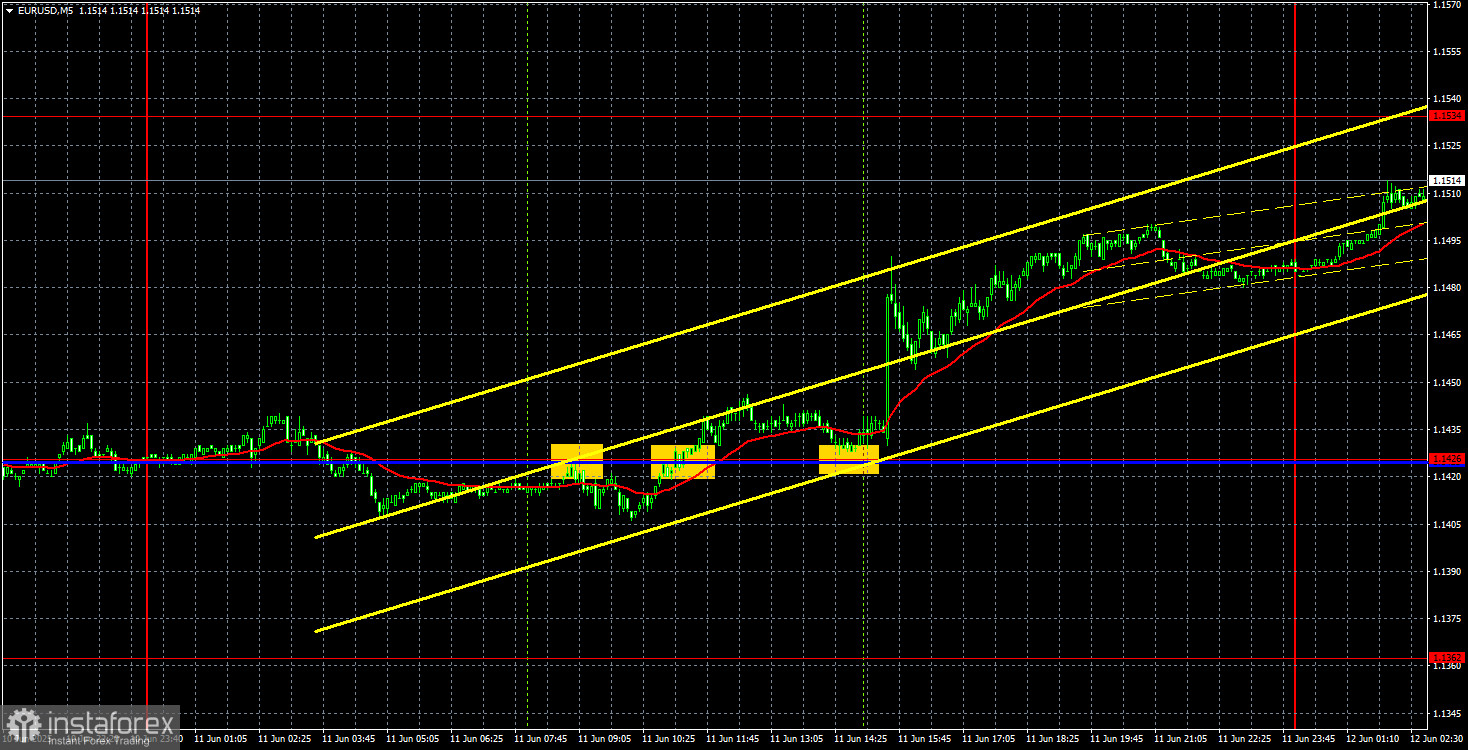
In the 5-minute timeframe, several trading signals were generated yesterday. Initially, the pair bounced off the critical line but failed to move down even 15 pips—a false signal. Later, the pair broke through the Kijun-sen line, allowing for long positions to be opened. Shortly thereafter, it bounced off the line from above, sparking a strong rally. The long position could be closed manually by evening since the nearest level was far away. However, the price may rise to 1.1534 by the end of the week.
COT Report
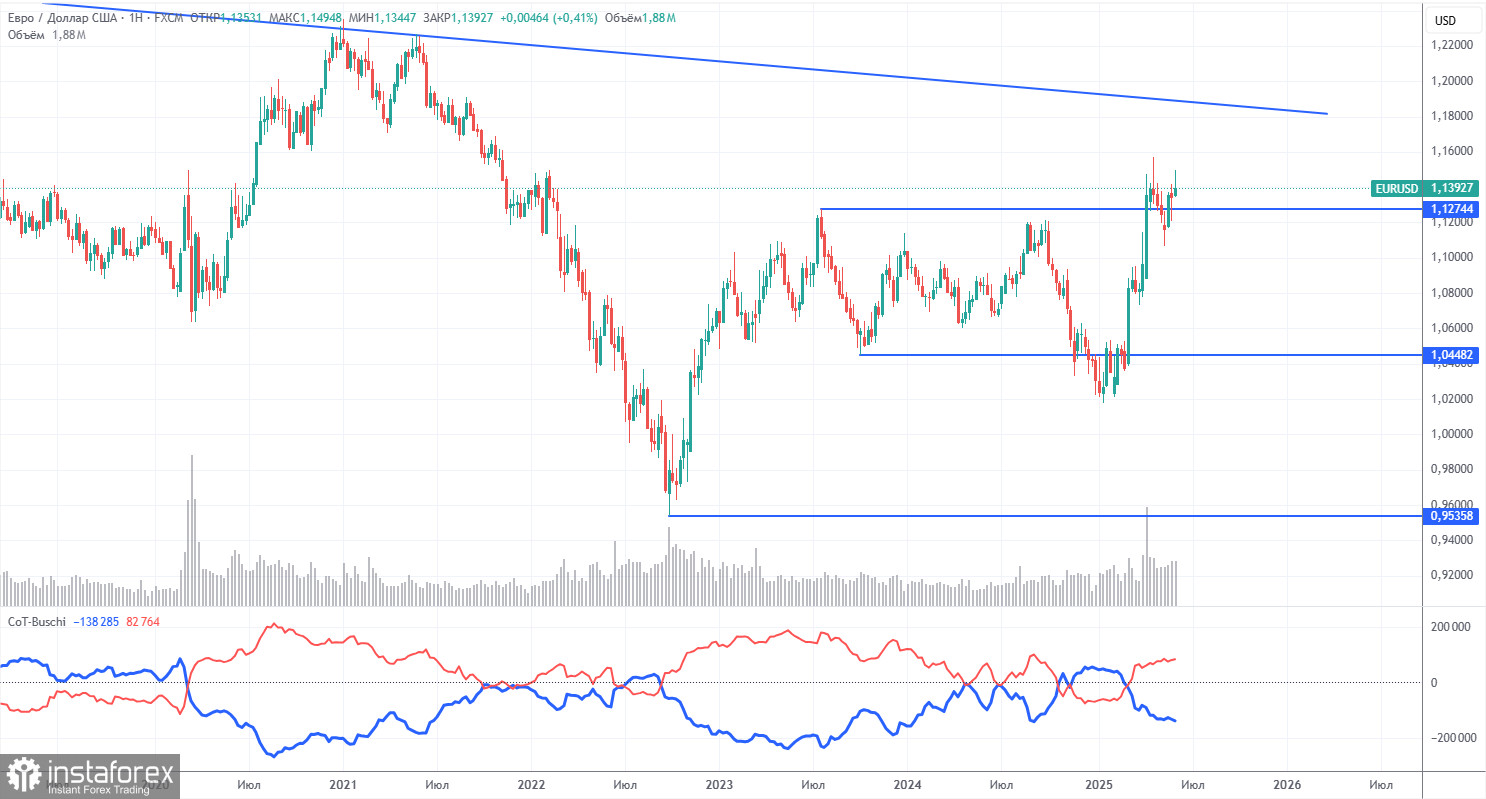
The latest COT report is dated June 3. The chart above shows that the net position of non-commercial traders had long been "bullish," and the bears barely managed to gain the upper hand at the end of 2024 but quickly lost it. Since Trump took office, only the dollar has been falling. We cannot confidently say that the dollar's decline will persist, but current global developments indicate this possibility.
We still see no fundamental factors for strengthening the euro, but one very significant factor is the decline of the dollar. The global downward trend persists, but what does the trend even matter now? Once Trump ends his trade wars, the dollar might start growing again — but will he end them, and when?
The red and blue lines have crossed again, meaning the market returns to a "bullish" trend. Over the last reporting week, the number of longs among the "Non-commercial" group decreased by 1,500, while shorts dropped by 4,800. As a result, the net position increased by 3,300.
EUR/USD 1-Hour Analysis
In the hourly timeframe, the EUR/USD pair maintains a local uptrend despite two breaches of the ascending trendline. As before (over the last 4 months), the market reacts only to events related to Trump, his decisions, and the trade war. Since there is little positive news on these topics, the dollar continues to decline regardless. Note that Fed policy combined with the European Central Bank policy suggests a strong dollar rise. However, as mentioned, this factor (like many others) currently does not influence the market.
For June 12, we identify the following trading levels: 1.0949, 1.1006, 1.1092, 1.1147, 1.1185, 1.1234, 1.1274, 1.1362, 1.1426, 1.1534, 1.1607, as well as Senkou Span B (1.1353) and Kijun-sen (1.1434) lines. Note that Ichimoku indicator lines may shift during the day, which should be considered when identifying signals. Don't forget to set your Stop Loss to break even once the price moves 15 pips in the right direction—this protects against potential losses if the signal turns out to be false.
No important events or reports are scheduled in the Eurozone on Thursday, while in the U.S., only the less significant PPI and jobless claims will be released. Since the CPI was published yesterday, the producer price index is unlikely to influence market sentiment.
Illustration Explanations:
- Support and resistance price levels – thick red lines where movement may end. They are not trading signal sources.
- Kijun-sen and Senkou Span B lines—These are strong Ichimoku indicator lines transferred to the hourly timeframe from the 4-hour one.
- Extremum levels – thin red lines where the price has previously rebounded. These act as trading signal sources.
- Yellow lines – trend lines, trend channels, and other technical patterns.
- COT Indicator 1 on the charts – the size of the net position for each category of traders.