empty
16.02.2024 06:42 AM
Trading Signals for EUR/USD on February 16-21, 2024: sell below 1.0790 (200 EMA - 1/8 Murray)

This image is no longer relevant

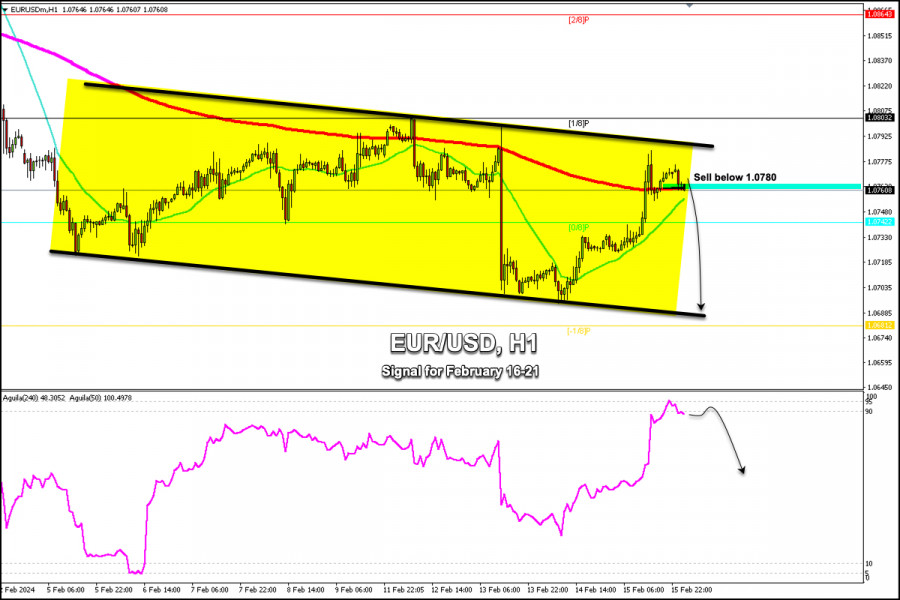
EUR/USD is trading at 1.0760 around the 200 EMA and above 0/8 Murray, showing exhaustion after yesterday's technical bounce.

On the H1 chart, we can see that the euro bounced above 1.0700, the bottom of the downtrend channel, and from that point reached the maximum level of 1.0784.

If the Euro trades below 1.0770 in the next few hours, we expect it to resume its bearish cycle and it could reach 1.0740 and even a key area of 1.0700.

Otherwise, as long as the euro trades above the 200 EMA located at 1.0770, the outlook could remain positive and we could expect the euro to reach the resistance zone of 1.0864 (2/8 Murray) in the coming days.

Above 2/8 Murray, the euro could turn down and reach the psychological level of 1.10. Below this area, the euro is likely to resume its bearish cycle.

The Eagle indicator on H1 shows that the euro has reached the overbought area. A technical correction in the euro is likely to occur in the next few hours povided that the EUR consolidates below 1.0790. Then, it could reach -1/8 Murray located at 1.0681.

Dimitrios Zappas,
Analytical expert of InstaForex
© 2007-2025
Summary
Urgency
Analytic
Dimitrios Zappas
Start trade
Earn on cryptocurrency rate changes with InstaForex
Download MetaTrader 4 and open your first trade
  • Grand Choice
    Contest by
    InstaForex
    InstaForex always strives to help you
    fulfill your biggest dreams.
    JOIN CONTEST

Recommended Stories

EUR/USD Forecast for July 14, 2025

Friday's candlestick for the EUR/USD pair closed bearish, with the price consolidating below the daily MACD line. The objective for today is to secure a close below the 1.1692 level

Laurie Bailey 05:31 2025-07-14 UTC+2

GBP/USD Forecast for July 14, 2025

On Friday, the British pound lost more than 80 pips, breaking below the daily balance line and the key signal level at 1.3510. The decline was driven by weak

Laurie Bailey 05:31 2025-07-14 UTC+2

AUD/USD Forecast for July 14, 2025

On the daily chart, the AUD/USD pair is positioned between the MACD line (0.6551) and the upper boundary of the local price channel (blue, 0.6597). A breakout of either level

Laurie Bailey 05:31 2025-07-14 UTC+2

Forecast for EUR/USD on July 11, 2025

On Thursday, the EUR/USD pair continued its decline toward the 1.1645 level, while the 127.2% Fibonacci corrective level at 1.1712 was largely ignored by traders. A rebound from 1.1645 would

Samir Klishi 12:44 2025-07-11 UTC+2

Forecast for GBP/USD on July 11, 2025

On the hourly chart, the GBP/USD pair on Thursday rebounded from the resistance zone of 1.3611–1.3633 and resumed its decline toward the 127.2% Fibonacci level at 1.3527. A rebound from

Samir Klishi 12:20 2025-07-11 UTC+2

Despite the potential for a correction, gold still has the potential to strengthen today, Friday, July 11, 2025.

XAU/USD, Friday, July 11, 2025. Although it appears to have corrected due to being held at Resistance 1, the continued strength of XAU/USD's technical and fundamental conditions provides an opportunity

Arief Makmur 08:00 2025-07-11 UTC+2

EUR/USD Forecast for July 11, 2025

EUR/USD On the weekly chart, we observe a set of reversal signals: divergence, a trend shift in the Fibonacci time zone, and a price rebound from the intersection

Laurie Bailey 07:09 2025-07-11 UTC+2

GBP/USD Forecast for July 11, 2025

GBP/USD On the monthly chart, the British pound reversed from the 161.8% Fibonacci reaction level, calculated from the upper boundary of the global 18-year price channel, immediately after

Laurie Bailey 06:46 2025-07-11 UTC+2

USD/CAD Forecast for July 11, 2025

USD/CAD The Canadian dollar had been consolidating for three days before today's upward breakout during the Pacific session. The price has already pierced the balance line with its upper shadow

Laurie Bailey 06:42 2025-07-11 UTC+2

Forecast for EUR/USD on July 10, 2025

On Wednesday, the EUR/USD pair continued to move along a trajectory known only to itself. The 127.2% Fibonacci correction level at 1.1712 was once again ignored by traders. I still

Samir Klishi 12:21 2025-07-10 UTC+2
Can't speak right now?
Ask your question in the chat.
Widget callback
 

Dear visitor,

Your IP address shows that you are currently located in the USA. If you are a resident of the United States, you are prohibited from using the services of InstaFintech Group including online trading, online transfers, deposit/withdrawal of funds, etc.

If you think you are seeing this message by mistake and your location is not the US, kindly proceed to the website. Otherwise, you must leave the website in order to comply with government restrictions.

Why does your IP address show your location as the USA?

  • - you are using a VPN provided by a hosting company based in the United States;
  • - your IP does not have proper WHOIS records;
  • - an error occurred in the WHOIS geolocation database.

Please confirm whether you are a US resident or not by clicking the relevant button below. If you choose the wrong option, being a US resident, you will not be able to open an account with InstaForex anyway.

We are sorry for any inconvenience caused by this message.