5M chart of EUR/USD
On Thursday, EUR/USD stretched its upward movement. While the last three days passed without any fundamental and macroeconomic background (and the euro still rose), on Thursday, some reports were published in the European Union and the United States. Germany released its consumer price index for March, which sharply fell by more than 1%. This was a strong reason for traders to become more aggressive, although it would have been more appropriate to sell the euro instead of buying it. The stronger and faster the fall in eurozone inflation, the lower the probability of further aggressive tightening of the European Central Bank monetary policy. Therefore, falling inflation at a fast pace is a bearish factor for the single currency. But the market ignored this fact and just kept buying.
There was only one signal on Thursday. The pair broke through 1.0868 and almost reached the target level of 1.0930. It fell short by only 3 pips. Therefore, traders had enough time and opportunity to close the long position with 30-50 pips profit. For most of the day, the movement was a trend and quite volatile, which is always a good thing. There were no false signals.
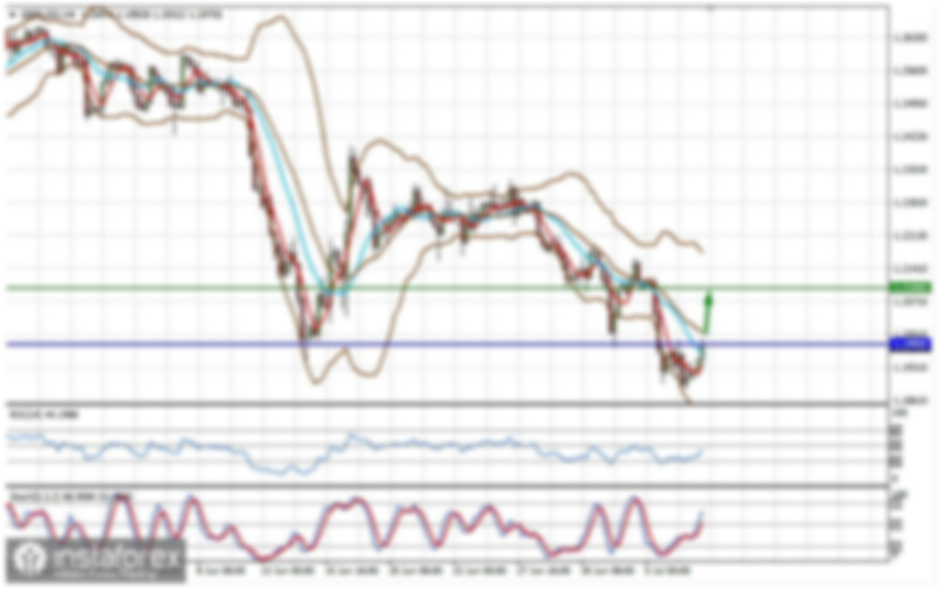
COT report:
On Friday, the new COT report for March 21 was released. The Commodity Futures Trading Commission has caught up with the lost time and has now released reports exactly on time. In the last few months, the picture was completely consistent with what was happening in the market. On the chart above, we see that the net non-commercial position of large traders (second indicator) has risen since September 2022. At about the same time, the euro started to rise. The net non-commercial position is bullish and only started to fall during the last couple of weeks, which coincides with the euro's decline. I have already drawn your attention to the fact that a fairly high value of the "net position" allows us to expect the uptrend to stop shortly. Such a signal comes from the first indicator, with the green line and the red line being far apart, which is usually a sign of the end of a trend. The euro has already started to fall, but we don't know if it's just a bearish correction or a new downtrend. According to the latest report, non-commercial traders closed 6,500 long positions, while the number of short ones decreased by 11,300. Consequently, the net position rose by 4,800. The number of long positions exceeds that of short ones by 145,000. In any case, a correction has been looming for a long time. Therefore, even without reports, it is clear that the downtrend will continue.
1H chart of EUR/USD
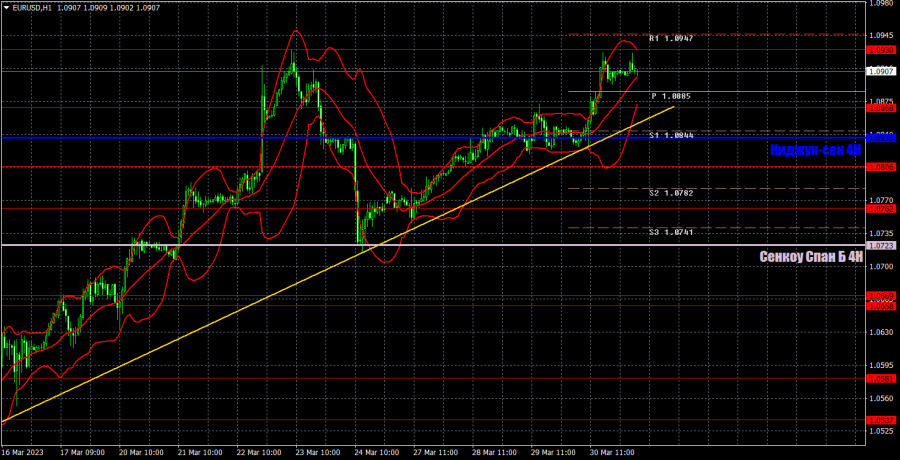
On the one-hour chart, EUR/USD has been rising again for no reason at all, and for the fifth straight day. The growth was not particularly impressive, but then again it's still growth and is actually stable. Even after crossing the previous trend line, the downward movement still did not start. Now the pair might try to consolidate below the new trend line and take the course towards the Senkou Span B line again. I still believe that the pair should start a sharp downward movement. On Friday, important levels are seen at 1.0537, 1.0581, 1.0658-1.0669, 1.0762, 1.0806, 1.0868, 1.0930, 1.1033, 1.1137-1.1185 and also Senkou Span B (1.0723) and Kijun Sen (1.0836) lines. Ichimoku indicator lines can move intraday, which should be taken into account when determining trading signals. There are also support and resistance although no signals are made near these levels. They could be made when the price either breaks or rebounds from these extreme levels. Do not forget to place Stop Loss at the breakeven point when the price goes by 15 pips in the right direction. In case of a false breakout, it could save you from possible losses. On March 31, the European Union will release its inflation report for March, while in the US, we will only receive secondary data like personal income and expenditures of the American population and the consumer sentiment index from the University of Michigan. Of course, the main focus is on the EU inflation report.
Indicators on charts:
Resistance/support - thick red lines, near which the trend may stop. They do not make trading signals.
Kijun-sen and Senkou Span B are the Ichimoku indicator lines moved to the hourly timeframe from the 4-hour timeframe. They are also strong lines.
Extreme levels are thin red lines, from which the price used to bounce earlier. They can produce trading signals.
Yellow lines are trend lines, trend channels, and any other technical patterns.
Indicator 1 on the COT chart is the size of the net position of each trader category.
Indicator 2 on the COT chart is the size of the net position for the Non-commercial group of traders.