empty
24.03.2023 10:00 AM
Technical Analysis of EUR/USD for March 24, 2023

Technical Market Outlook:

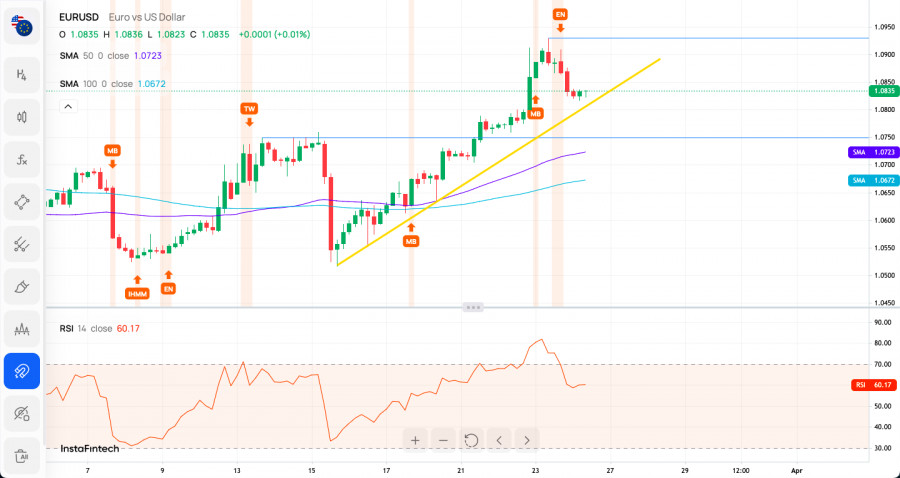
The EUR/USD pair has made a new swing high at the level of 1.0930 and the rally was capped at the level due to the extremely overbought market conditions on the H4 time frame chart. After the Bearish Engulfing candlestick pattern was made at the H4 time frame chart, the EUR started the corrective cycle. The intraday technical support is seen at the level of 1.0789 and the intraday technical resistance is located at 1.0940, but in a case of a breakout, the next target for bulls is seen at the level of 1.1033 (swing high from Feb 2). The strong and positive momentum on the H4 time-frame chart support the short-term bullish outlook for EUR, however the market conditions are now extremely overbought on this time frame.

This image is no longer relevant

Weekly Pivot Points:

WR3 - 1.07258

WR2 - 1.07006

WR1 - 1.06865

Weekly Pivot - 1.06754

WS1 - 1.06613

WS2 - 1.06502

WS3 - 1.06250

Trading Outlook:

Since the beginning of October 2022 the EUR/USD is in the corrective cycle to the upside, but the main, long-term trend remains bearish. This corrective cycle might had been terminated at the level of 1.1033 which is 50% Fibonacci retracement level. The EUR had made a new multi-decade low at the level of 0.9538, so as long as the USD is being bought all across the board, the down trend will continue towards the new lows.

Summary
Urgency
Analytic
Sebastian Seliga
Start trade
Earn on cryptocurrency rate changes with InstaForex
Download MetaTrader 4 and open your first trade
  • Grand Choice
    Contest by
    InstaForex
    InstaForex always strives to help you
    fulfill your biggest dreams.
    JOIN CONTEST

Recommended Stories

Forex forecast 01/08/2025: EUR/USD, USD/JPY, GBP/USD, Gold and Bitcoin

Useful links: My other articles are available in this section InstaForex course for beginners Popular Analytics Open trading account Important: The begginers in forex trading need to be very careful

Sebastian Seliga 12:24 2025-08-01 UTC+2

Forecast for EUR/USD on August 1, 2025

On Thursday, the EUR/USD pair returned to the 76.4% Fibonacci retracement level at 1.1454, rebounded from it, and reversed in favor of the US dollar. However, the bears failed

Samir Klishi 11:27 2025-08-01 UTC+2

Forecast for GBP/USD on August 1, 2025

On the hourly chart, the GBP/USD pair on Thursday consolidated below the 127.2% retracement level at 1.3258, which suggests a potential continuation of the decline toward the support zone

Samir Klishi 11:11 2025-08-01 UTC+2

EUR/USD. Indicator Analysis and Daily Overview on August 1, 2025

On Thursday, the pair moved upward and tested the 14.6% retracement level at 1.1456 (yellow dashed line), after which the price turned downward and closed the daily candlestick at 1.1414

Stefan Doll 09:48 2025-08-01 UTC+2

Trading Signals for BITCOIN for August 1-5, 2025: buy above $115,000 (200 EMA - 5/8 Murray)

Yesterday, Bitcoin reached strong resistance around the 6/8 Murray level at 118,900 during the American session. BTC failed to break above this area and made a sharp drop

Dimitrios Zappas 07:50 2025-08-01 UTC+2

Trading Signals for GOLD (XAU/USD) for August 1-4, 2025: buy above $3,281 (21 SMA - 4/8 Murray)

Gold is trading around 3,292, bouncing above the 4/8 Murray level and forming a technical pattern called a pennant. A break above 3,396, or even a consolidation above

Dimitrios Zappas 07:47 2025-08-01 UTC+2

EUR/USD Forecast for August 1, 2025

Yesterday, markets saw a broad retreat from risk assets: the S&P 500 declined by 0.37%, the U.S. Dollar Index rose by 0.16%, and oil fell by 0.90%. Yields on government

Laurie Bailey 04:52 2025-08-01 UTC+2

GBP/USD Forecast for August 1, 2025

Yesterday, the British pound spent the day within the expected range of 1.3206–1.3265, closing the day with a black candlestick, while today opened below the lower boundary of that range

Laurie Bailey 04:50 2025-08-01 UTC+2

EUR/JPY Forecast for August 1, 2025

The EUR/JPY pair has fallen sharply from the upper boundary of the price channel, almost at the same time as the Marlin oscillator entered negative territory (daily chart). Yesterday

Laurie Bailey 04:42 2025-08-01 UTC+2

Forecast for EUR/USD on July 31, 2025

On Wednesday, the EUR/USD pair continued its decline after rebounding from the 100.0% Fibonacci retracement level at 1.1574. By the end of the day, the pair closed below the 76.4%

Samir Klishi 13:23 2025-07-31 UTC+2
Can't speak right now?
Ask your question in the chat.
Widget callback
 

Dear visitor,

Your IP address shows that you are currently located in the USA. If you are a resident of the United States, you are prohibited from using the services of InstaFintech Group including online trading, online transfers, deposit/withdrawal of funds, etc.

If you think you are seeing this message by mistake and your location is not the US, kindly proceed to the website. Otherwise, you must leave the website in order to comply with government restrictions.

Why does your IP address show your location as the USA?

  • - you are using a VPN provided by a hosting company based in the United States;
  • - your IP does not have proper WHOIS records;
  • - an error occurred in the WHOIS geolocation database.

Please confirm whether you are a US resident or not by clicking the relevant button below. If you choose the wrong option, being a US resident, you will not be able to open an account with InstaForex anyway.

We are sorry for any inconvenience caused by this message.