signal strength 1 of 5
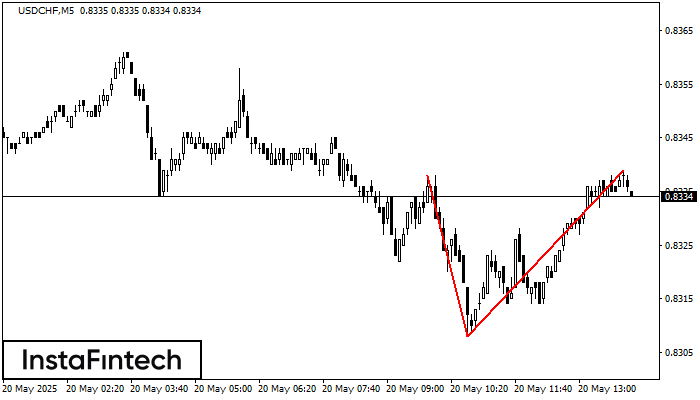
The Double Top reversal pattern has been formed on USDCHF M5. Characteristics: the upper boundary 0.8338; the lower boundary 0.8308; the width of the pattern is 31 points. Sell trades are better to be opened below the lower boundary 0.8308 with a possible movements towards the 0.8293 level.
The M5 and M15 time frames may have more false entry points.
See Also
- All
- Double Top
- Flag
- Head and Shoulders
- Pennant
- Rectangle
- Triangle
- Triple top
- All
- #AAPL
- #AMZN
- #Bitcoin
- #EBAY
- #FB
- #GOOG
- #INTC
- #KO
- #MA
- #MCD
- #MSFT
- #NTDOY
- #PEP
- #TSLA
- #TWTR
- AUDCAD
- AUDCHF
- AUDJPY
- AUDUSD
- EURCAD
- EURCHF
- EURGBP
- EURJPY
- EURNZD
- EURRUB
- EURUSD
- GBPAUD
- GBPCHF
- GBPJPY
- GBPUSD
- GOLD
- NZDCAD
- NZDCHF
- NZDJPY
- NZDUSD
- SILVER
- USDCAD
- USDCHF
- USDJPY
- USDRUB
- All
- M5
- M15
- M30
- H1
- D1
- All
- Buy
- Sale
- All
- 1
- 2
- 3
- 4
- 5
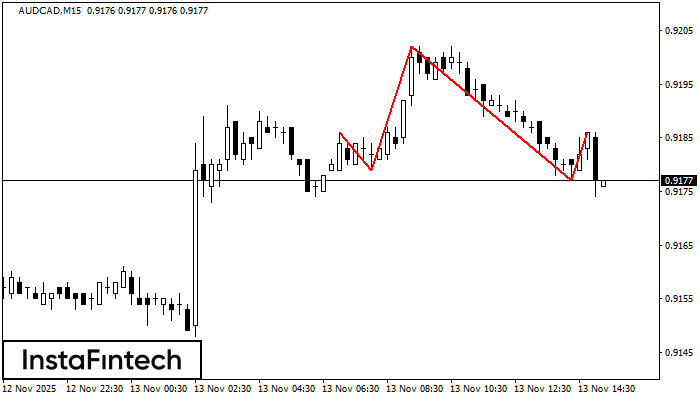
The technical pattern called Head and Shoulders has appeared on the chart of AUDCAD M15. There are weighty reasons to suggest that the price will surpass the Neckline 0.9179/0.9177 after
The M5 and M15 time frames may have more false entry points.
Open chart in a new window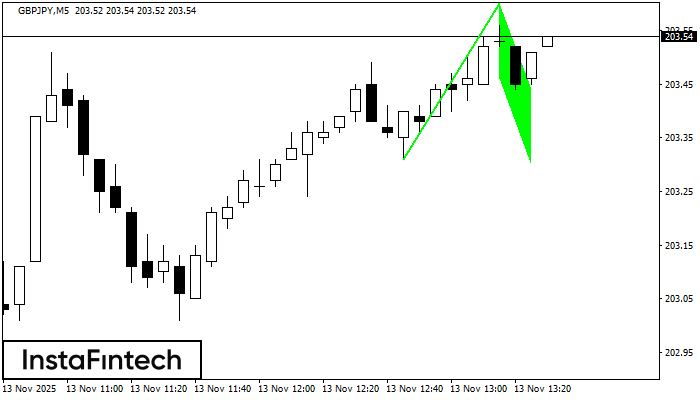
The Bullish Flag pattern has been formed on the chart GBPJPY M5 which signals that the upward trend will continue. Signals: а break of the peak at 203.60 may push
The M5 and M15 time frames may have more false entry points.
Open chart in a new window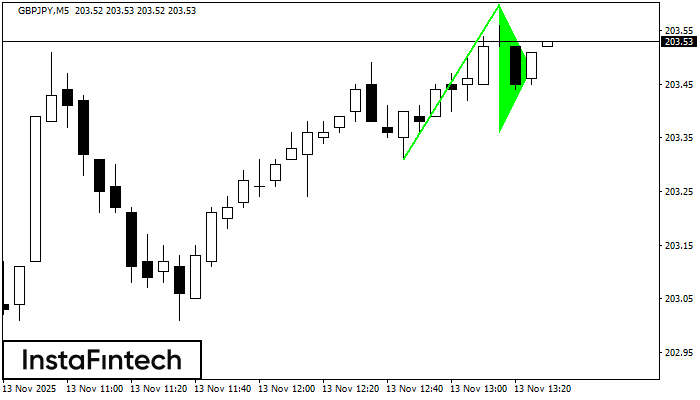
The Bullish pennant pattern is formed on the GBPJPY M5 chart. It is a type of the continuation pattern. Supposedly, in case the price is fixed above the pennant’s high
The M5 and M15 time frames may have more false entry points.
Open chart in a new window