EUR/USD 5-Minute Analysis
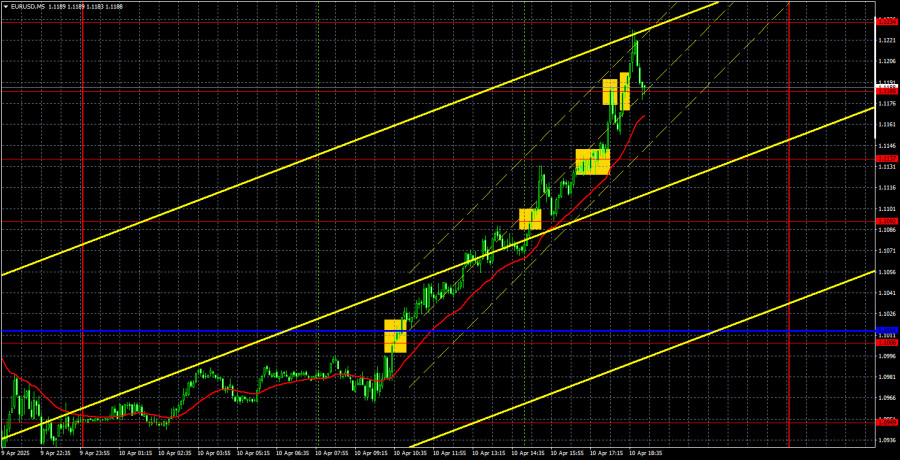
The EUR/USD currency pair showed ultra-strong growth on Thursday—a move that, by now, probably surprised no one. Just as we reported that tariffs on China had been raised to 125%, Trump raised them again to 145%. The theater of the absurd continues. At this rate, we could easily see tariffs rise to 500% by the end of the month—a prediction we made yesterday half-jokingly. However, astronomical numbers are around the corner if the U.S. president continues to hike tariffs daily.
It is becoming increasingly clear that Trump's primary trade war adversaries are the European Union and China. While it may still be possible—albeit difficult—to strike a deal with Europe, China has essentially been in a trade war for eight years. They're used to it. The Chinese government is willing to discuss a trade agreement, but only if it's mutually beneficial—not just Trump's ultimatums. As it stands, there are no ongoing negotiations. Beijing will likely continue to respond with mirror tariffs. The market, meanwhile, continues to react to the most significant confrontations. The U.S.-China standoff is the most impactful, so the dollar barely reacted to the 90-day grace period for 75 countries but dropped another 3 cents following the latest tariff increase on China.
On the 5-minute chart, it's clear the price moved upward all day. Long positions could have been opened near the critical Kijun-sen line and closed around the 1.1185 level. This single trade alone could have yielded around 140 pips of profit.
COT Report
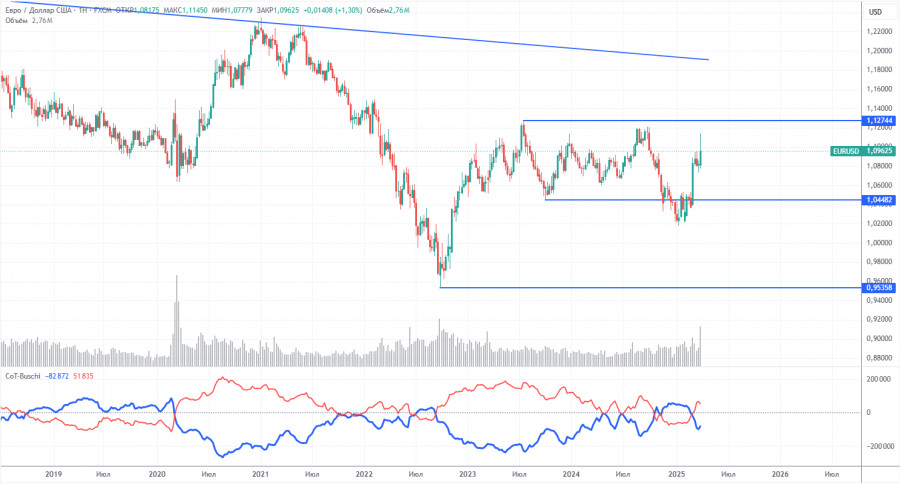
The latest COT report is dated April 1. As shown in the chart, the net position of non-commercial traders remained bullish for a long time. The bears barely managed to gain control briefly, but now the bulls are back in charge. The bears' advantage has faded fast since Trump took office, and the dollar has since plunged. We cannot say definitively that the dollar's decline will continue, and the COT reports reflect sentiment among major players, which can shift quickly in today's environment.
We still see no fundamental factors supporting euro strength—but one decisive factor for dollar weakness has emerged. The correction may last for weeks or even months, but a 16-year downward trend isn't going to end so quickly.
The red and blue lines have crossed again, indicating a bullish market trend. During the latest reporting week, the number of long positions in the "non-commercial" group fell by 6,500, while short positions increased by 7,100. As a result, the net position declined by 13,600 contracts.
EUR/USD 1-Hour Analysis
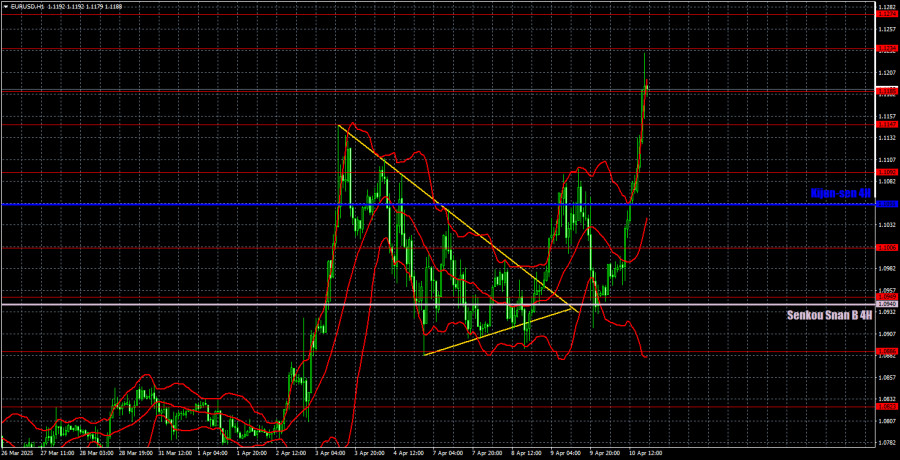
The EUR/USD pair quickly resumed its upward trend on the hourly timeframe when Trump began imposing new tariffs. We believe a medium-term decline will eventually resume, but it's unclear how long the market will continue to price in the "Trump factor"—or where the pair will be after that. It's also unknown how much longer Trump will continue fueling global tension. Currently, the markets are ruled by panic and chaos, and if we previously hesitated to forecast price movements even a week ahead, it's all the more difficult now. The only recommendation is to wait out the "crisis" or trade intraday only for now.
Key levels for trading on April 11: 1.0658–1.0669, 1.0757, 1.0797, 1.0823, 1.0886, 1.0949, 1.1006, 1.1092, 1.1147, 1.1185, 1.1234, 1.1274, 1.1323, 1.1391. Also, monitor the Senkou Span B line (1.0940) and the Kijun-sen line (1.1055). Note that the Ichimoku indicator lines may shift throughout the day, which should be considered when identifying trade signals. Don't forget to set your Stop Loss to break even after the price moves 15 pips in the correct direction. This will help protect against losses in the event of a false signal.
We won't even list Friday's macroeconomic events, as they currently have no meaningful influence on the pair's movement. Yesterday's U.S. inflation report had zero impact on market dynamics. Today's reports are even less important, but if China responds to Trump, it will be crucial and worth watching.
Illustration Explanations:
- Support and Resistance Levels (thick red lines): Thick red lines indicate where movement may come to an end. Please note that these lines are not sources of trading signals.
- Kijun-sen and Senkou Span B Lines: Ichimoku indicator lines transferred from the 4-hour timeframe to the hourly timeframe. These are strong lines.
- Extreme Levels (thin red lines): Thin red lines where the price has previously bounced. These serve as sources of trading signals.
- Yellow Lines: Trendlines, trend channels, or any other technical patterns.
- Indicator 1 on COT Charts: Represents the net position size for each category of traders.


