empty
01.11.2023 06:45 AM
EUR/USD and GBP/USD: Technical analysis for November 1

EUR/USD

This image is no longer relevant

Higher Timeframes

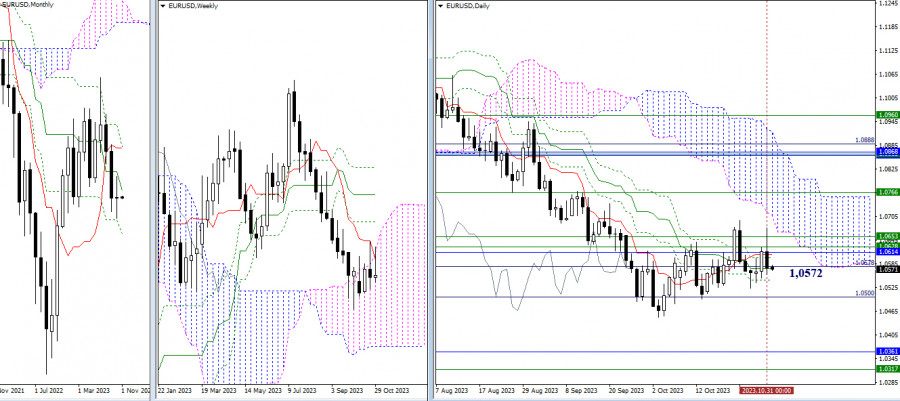
October closed with a candle of uncertainty. The market continues to operate within the range of daily levels, with the center of attraction being the medium-term trend (1.0572). At the start of the new trading month, minor adjustments to the Ichimoku indicator on the monthly timeframe led to the strengthening of the current weekly resistance zone (1.0628 - 1.0653) by the monthly medium-term trend (1.0614). As a result, the immediate objectives for bullish players, at the moment, are breaking through resistance levels (1.0614-28-53), updating the high (1.0695), and entering the daily cloud.

In the current situation, bearish players' prospects are focused on breaking through supports at 1.0500 - 1.0449 (the daily target level + the low) and declining towards the final level of the monthly Ichimoku cross (1.0360) and the lower boundary of the weekly cloud (1.0317).

This image is no longer relevant

H4 – H1

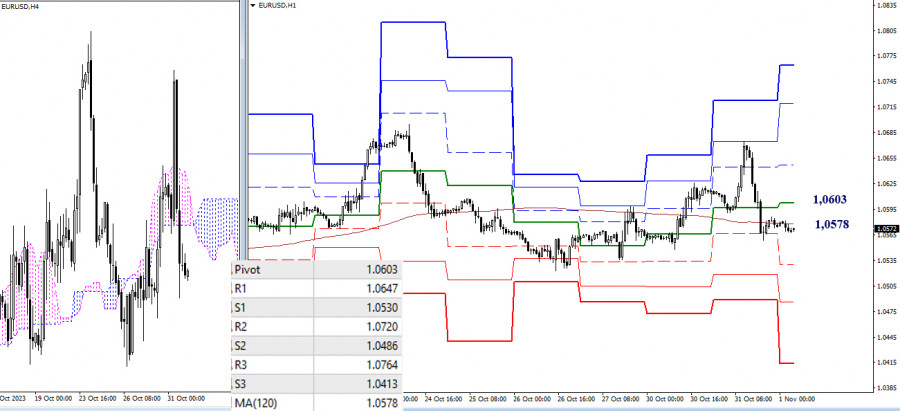
On the lower timeframes, there is also uncertainty in the past few hours. The market is hovering around the attraction zone of the weekly long-term trend (1.0578). The moving average is currently in a nearly horizontal position, confirming the balance of power. In the event of bearish activity and a strengthening of their sentiments, attention will be on passing through the supports of the classic pivot points (1.0530 - 1.0486 - 1.0413). If bulls restore their positions, their interests will shift towards breaking through the resistances of the classic pivot points (1.0603 - 1.0647 - 1.0720 - 1.0764).

***

GBP/USD

This image is no longer relevant

Higher Timeframes

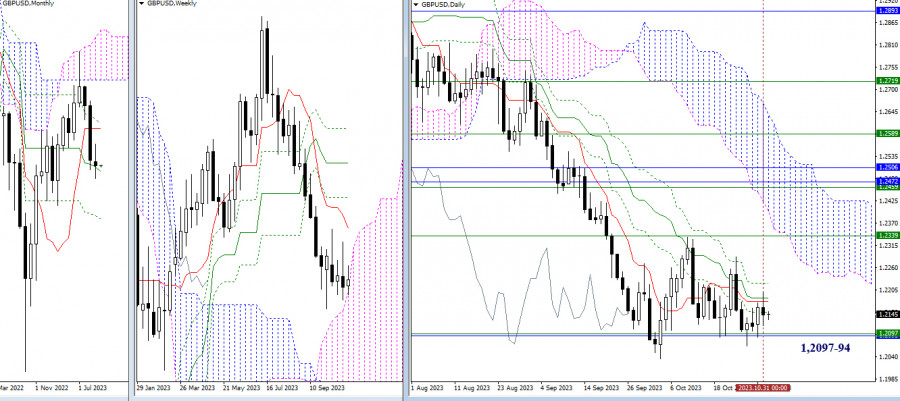
October did not provide clear support to any market players. The pair continues to consolidate around the upper boundary of the weekly cloud (1.2097). Most likely, the pound has decided to enter the weekly cloud in a sideways movement while utilizing the support of the monthly medium-term trend (1.2094). Only directed movement can change the situation. For bullish players, it is still important to overcome the attraction of the daily cross levels (1.2151 - 1.2178 - 1.2186 - 1.2221) and secure the support of the weekly short-term trend (1.2339). For bears, it is necessary to break free from the attraction of levels 1.2094 - 1.2097 and restore the downward trend (1.2036) to continue the decline.

This image is no longer relevant

H4 – H1

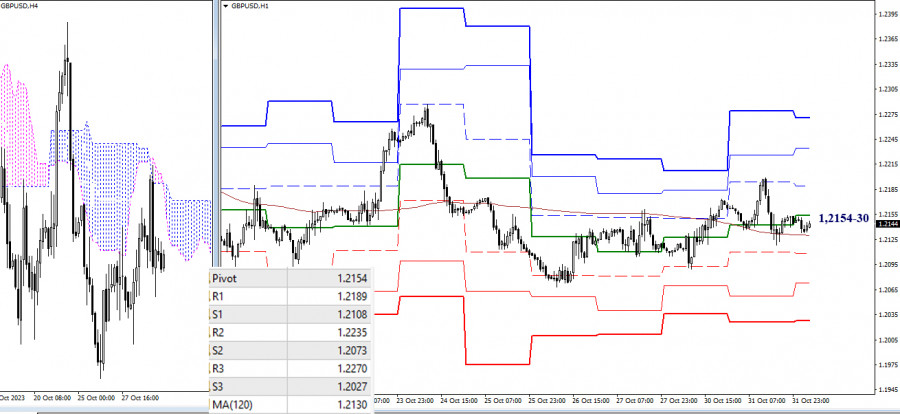
On the lower timeframes, the market is in a state of uncertainty and attraction to key levels, which are currently converging in the 1.2154-30 range (central pivot point + weekly long-term trend). Trading below these key levels will favor the development of bearish sentiments. Intraday bearish targets today are at 1.2108 - 1.2073 - 1.2027 (classic pivot points). Trading above these key levels will contribute to the strengthening of bullish positions. Intraday bullish targets can be noted at 1.2189 - 1.2235 - 1.2270 (resistances of the classic pivot points).

***

The technical analysis of the situation uses:

Higher timeframes - Ichimoku Kinko Hyo (9.26.52) + Fibo Kijun levels

Lower timeframes - H1 - Pivot Points (classic) + Moving Average 120 (weekly long-term trend)

Summary
Urgency
Analytic
Zhizhko Nadezhda
Start trade
รับผลกำไรจากการเปลี่ยนแปลงอัตราสกุลเงินดิจิทัลกับ InstaForex.
ดาวน์โหลด MetaTrader 4 และเปิดการซื้อขายครั้งแรกของคุณ.
USD/CAD: การวิเคราะห์และคาดการณ์ ในวันพุธ คู่เงิน USD/CAD เข้าสู่ช่วงของการปรับตัวเชิงบวก โดยเคลื่อนไหวใกล้กับระดับสูงสุดห้าสัปดาห์ที่เพิ่งแตะไปเมื่อวันก่อนเท่านั้น นักเทรดต่างชะลอการถือสถานะอย่างก้าวร้าวก่อนการตัดสินใจครั้งสำคัญของธนาคารกลาง โดยธนาคารกลางแคนาดาและธนาคารกลางสหรัฐจะประกาศการตัดสินใจเกี่ยวกับนโยบายการเงินในช่วงการซื้อขายของทวีปอเมริกาเหนือ อย่างไรก็ตาม ปัจจัยพื้นฐานดูเหมือนจะเอื้อต่อแนวโน้มขาขึ้น ซึ่งบ่งบอกว่าทางที่มีความต้านทานน้อยที่สุดสำหรับราคาอาจจะคือการไปทางขาขึ้น คาดว่าธนาคารกลางแคนาดาจะยังรักษาท่าทีเชิงระมัดระวังท่ามกลางสภาวะไม่แน่นอน และจะยังคงอัตราดอกเบี้ยไว้ที่ 2.75% เป็นครั้งที่สามติดต่อกัน ขณะเดียวกัน
  • Chancy Deposit
    ฝากเงินในบัญชีของคุณใน $3,000 และรับ $4000 ไปเพิ่ม!
    ใน กรกฎาคม ทางเราได้ออก$4000 ภายในแคมเปญ Chancy Deposit !
    คว้าโอกาสที่จะชนะด้วยการฝากเงิน $3,000 ไปในบัญชีเทรด เมื่อทำตามเงื่อนไขนี้แล้ว คุณก็จะกลายเป็นผู้เข้าร่วมแคมเปญ
    เข้าร่วมการแข่งขัน


บทความแนะนำ

XAU/USD: การวิเคราะห์และการคาดการณ์

จากมุมมองทางเทคนิคบนกราฟ 4 ชั่วโมง การที่ราคาหลุดเส้นค่าเฉลี่ยเคลื่อนที่ธรรมดา (SMA) 100 ช่วง นับว่าเป็นสัญญาณขาลงที่สำคัญ นอกจากนี้ ออสซิลเลเตอร์บนกราฟเดียวกันอยู่ในโซนลบ บ่งชี้ว่าการเคลื่อนไหวขึ้นใดๆ ต่อจากนี้ควรถูกมองเป็นโอกาสในการขายและมีแนวโน้มที่จะจำกัดอยู่ในกรอบนี้ อย่างไรก็ตาม การฟื้นตัวเล็กน้อยจากระดับต่ำสุดในรอบเกือบสามสัปดาห์ที่ประมาณ $3300

Irina Yanina 12:08 2025-07-30 UTC+2

EUR/USD. วันที่ 30 กรกฎาคม ตลาดหมีหยุดชั่วคราว แต่สิ่งท้าทายใหม่ ๆ รออยู่

เมื่อวันอังคาร คู่เงิน EUR/USD ยังคงมีแนวโน้มปรับตัวลงและปิดตลาดต่ำกว่าระดับ Fibonacci retracement 100.0% ที่ 1.1574 ซึ่งบ่งบอกว่าการลดลงอาจดำเนินต่อไปในวันพุธ โดยมีเป้าหมายที่ระดับ Fibonacci ถัดไปที่ 76.4% —

Samir Klishi 12:02 2025-07-30 UTC+2

GBP/USD. 30 กรกฎาคม ธนาคารกลางสหรัฐอาจช่วยพยุงค่าเงินดอลลาร์

ในกราฟรายชั่วโมง ค่าเงินคู่ GBP/USD ยังคงลดลงต่อเนื่องในวันอังคารและปิดตัวต่ำกว่าพื้นที่แนวรับที่ 1.3357–1.3371 ดังนั้น ค่าเงินปอนด์อาจลดลงต่อในวันพุธไปยังระดับ Fibonacci ถัดไปที่ 127.2% ที่ 1.3258 การที่ค่าเงินปอนด์ยืนเหนือพื้นที่ 1.3357–1.3371 ได้จะเป็นการสนับสนุนค่าเงินปอนด์และเปิดโอกาสให้สูงขึ้นไปถึงระดับ

Samir Klishi 11:58 2025-07-30 UTC+2

การคาดการณ์ Forex วันที่ 30/07/2025: EUR/USD, USD/CAD, USD/JPY, น้ำมัน และ Bitcoin

ลิงก์ที่มีประโยชน์: บทความอื่นๆ ของฉันมีอยู่ในส่วนนี้ หลักสูตร InstaForex สำหรับผู้เริ่มต้น การวิเคราะห์ที่ได้รับความนิยม เปิดบัญชีเทรด สำคัญ: ผู้เริ่มต้นในการเทรดฟอเร็กซ์ควรระมัดระวังอย่างมากในการตัดสินใจเข้าสู่ตลาด ก่อนการประกาศรายงานสำคัญ ควรหลีกเลี่ยงการเข้าตลาดเพื่อป้องกันการเผชิญกับความผันผวนของตลาดที่เกิดจากความผันผวนที่เพิ่มขึ้น ถ้าตัดสินใจเทรดในช่วงเวลาออกข่าว ควรตั้งคำสั่งหยุดขาดทุนเสมอเพื่อจำกัดการสูญเสีย หากไม่ตั้งคำสั่งหยุดขาดทุน

Sebastian Seliga 10:22 2025-07-30 UTC+2

สัญญาณการเทรดสำหรับ GOLD (XAU/USD) สำหรับวันที่ 30-31 กรกฎาคม 2025: ซื้อเหนือ $3,320 (21 SMA - 5/8 Murray)

ราคาทองคำกำลังซื้อขายรอบ 3,332 โดยฟื้นตัวหลังจากที่เคยลดลงถึงระดับสำคัญที่ $3,300 โดยคาดว่าราคาทองคำจะขยับขึ้นไปที่ระดับ 7/8 ของ Murray ใกล้เคียงกับ 3,398 ในอีกไม่กี่วันข้างหน้า ทองคำกำลังแสดงสัญญาณบวก ดังนั้นการย้อนกลับใดๆ ตราบใดที่ราคาทองคำยังคงอยู่เหนือระดับ 5/8

Dimitrios Zappas 07:08 2025-07-30 UTC+2

สัญญาณการซื้อขายสำหรับ EUR/USD วันที่ 30-31 กรกฎาคม 2025: ซื้อเหนือ 1.1530 (การดีดตัวกลับ - 6/8 Murray)

ในช่วงต้นของการซื้อขายในยุโรป ยูโรอยู่ที่ประมาณ 1.1564 ที่กำลังฟื้นตัวหลังจากลงไปแตะระดับต่ำสุดที่ประมาณ 1.1518 ระดับนี้ทำหน้าที่เป็นแนวรับที่ดีสำหรับยูโร ตั้งแต่นั้นมาเราจะเห็นการฟื้นตัว ซึ่งมีแนวโน้มที่จะเพิ่มขึ้นในอีกไม่กี่ชั่วโมงข้างหน้าเพื่อไปยัง 21SMA หรือ 200EMA ถ้ายูโรฟื้นตัวรอบ 1.1518 หรือหากแรงกดดันขาลงยังคงดำเนินไป มันอาจพบแนวรับแข็งแกร่งรอบเส้นมอร์เรย์

Dimitrios Zappas 07:07 2025-07-30 UTC+2

สัญญาณการซื้อขายสำหรับ BITCOIN สำหรับวันที่ 30-31 กรกฎาคม 2025: ขายต่ำกว่า $118,750 (6/8 มิวเรย์ - 21 SMA)

Bitcoin กำลังซื้อขายอยู่ที่ประมาณ 117,547 ต่ำกว่าระดับ 6/8 ของ Murray ต่ำกว่าค่าเฉลี่ยเคลื่อนที่ระยะสั้น 21 วัน (SMA) และอยู่ภายในช่องแนวโน้มขาลงที่เกิดขึ้นเมื่อวันที่ 12 กรกฎาคม Bitcoin

Dimitrios Zappas 07:05 2025-07-30 UTC+2

แม้ว่าจะมีศักยภาพในการปรับฐานจำกัด USD/CHF ยังคงมีแนวโน้มขาขึ้นในภาพรวม ในวันพุธที่ 30 กรกฎาคม 2025

USD/CHF – วันพุธที่ 30 กรกฎาคม 2025 การปรากฏของการแตกต่างระหว่างการเคลื่อนไหวของราคา USD/CHF กับตัวบ่งชี้ RSI(14) บ่งชี้ถึงศักยภาพในการปรับตัวที่จำกัด แม้ว่า RSI(14) จะเป็นกลาง-ขาลง แต่แนวโน้มโดยรวมของ

Arief Makmur 06:50 2025-07-30 UTC+2

ผู้ขายที่ครองตลาดใน AUD/USD สามารถทำลายระดับจุดหมุนในวันนี้ วันพุธที่ 30 กรกฎาคม 2025 ได้หรือไม่?

AUD/USD – วันพุธที่ 30 กรกฎาคม 2025 แม้ว่าเงื่อนไข RSI (14) จะอยู่ในพื้นที่เป็นกลางอ่อนถึงขาขึ้น แต่ EMA (50) อยู่ต่ำกว่า

Arief Makmur 06:50 2025-07-30 UTC+2

การพยากรณ์ EUR/USD สำหรับวันที่ 30 กรกฎาคม 2025

เมื่อวันอังคารที่ผ่านมา ยูโรลดลง 42 pips การเคลื่อนไหวที่ลดลงหยุดลงที่ค่าเฉลี่ย 55 วัน (MA55) ขณะนี้การทดสอบแนวรับเป้าหมายที่ 1.1495 — หากตลาดตัดสินใจตอบสนองต่อคำแนะนำจาก FOMC — อาจเกิดขึ้นผ่านการเบรกเอาท์อย่างรวดเร็ว

Laurie Bailey 05:13 2025-07-30 UTC+2
หากไม่สะดวกคุยในตอนนี้
ระบุคำถามไว้ได้ใน แชท.
Widget callback
 

Dear visitor,

Your IP address shows that you are currently located in the USA. If you are a resident of the United States, you are prohibited from using the services of InstaFintech Group including online trading, online transfers, deposit/withdrawal of funds, etc.

If you think you are seeing this message by mistake and your location is not the US, kindly proceed to the website. Otherwise, you must leave the website in order to comply with government restrictions.

Why does your IP address show your location as the USA?

  • - you are using a VPN provided by a hosting company based in the United States;
  • - your IP does not have proper WHOIS records;
  • - an error occurred in the WHOIS geolocation database.

Please confirm whether you are a US resident or not by clicking the relevant button below. If you choose the wrong option, being a US resident, you will not be able to open an account with InstaForex anyway.

We are sorry for any inconvenience caused by this message.