empty
31.03.2023 01:17 PM
EUR/USD: trading plan for American session on March 31. Overview of morning trades. EUR declines following eurozone inflation data

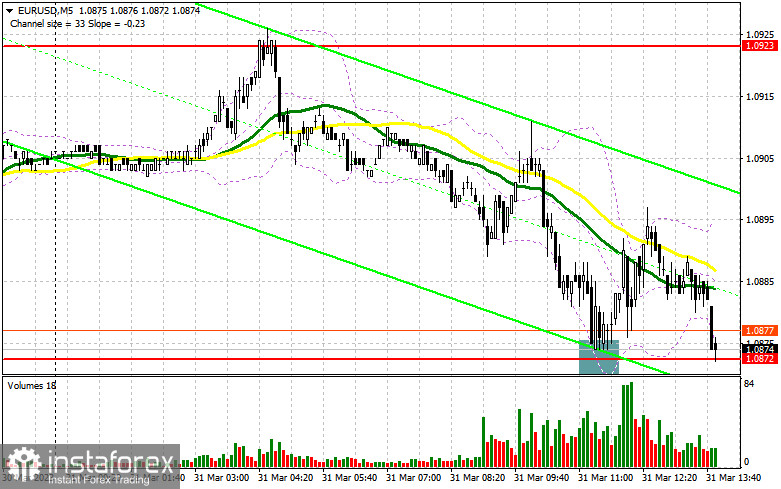
In my morning article, I turned your attention to 1.0872 and recommended making decisions with this level in focus. Now, let's look at the 5-minute chart and figure out what actually happened. A decline and a false breakout of this level led to a buy signal. Yet, the eurozone inflation report undermined a bullish bias. After a 20-pip rise, the pressure on the pair increased. For the afternoon, the technical outlook remained the same.

This image is no longer relevant

When to open long positions on EUR/USD:

Inflation in the eurozone declined more than expected. However, the Core CPI rose. The ECB feared such an outcome. So, a drop in the CPI will not affect the regulator's plans to raise rates further. Do not forget that today is the end of the month, so a correction in the euro may occur. The US will also unveil a crucial economic report, namely the Core PCE Price Index. The Fed closely monitors this indicator as it shows changes in inflation. A decrease in the index will certainly weaken the US dollar and boost demand for the euro. In the meantime, I would advise you to stick to the morning scenario. In case of another decrease to the support level of 1.0872, just above which the moving averages are passing, it is better to open long positions only after a false breakout. It could provide new entry points and cause an upward movement to the monthly high of 1.0923. Only a false breakout and a downward retest of this level will lead to a buy signal with a rise to 1.0975 where I recommend locking in profits. A more distant target will be the 1.1002 level. However, it will hardly hit this level. If EUR/USD declines and buyers show no activity at 1.0872 in the afternoon, which is more likely, the pressure on the euro will increase. There could be a downward movement to 1.0825. Only a false breakout of this level will create new entry points into long positions. You could buy EUR/USD at a bounce from a low of 1.0787 or 1.0748, keeping in mind an upward intraday correction of 30-35 pips.

When to open short positions on EUR/USD:

Sellers finally got the chance to regain control. However, it is too early to talk about a new downward correction. It is better to open new short positions after a false breakout of 1.0923. It may occur only after the release of weak US data. It may lead to another decline to the support level of 1.0872. A breakout and an upward retest of this level will deliver a severe blow to bulls. The pair is likely to decrease to 1.0825. A fall below this level will also push the pair to 1.0787, which will facilitate a downward correction. At this level, I recommend locking in profits. If EUR/USD rises during the American session and bears show no energy at 1.0923, I would advise you to postpone short positions until a breakout of 1.0975. You could EUR/USD only after a bounce from 1.1002, keeping in mind a downward intraday correction of 30-35 pips.

This image is no longer relevant

COT report

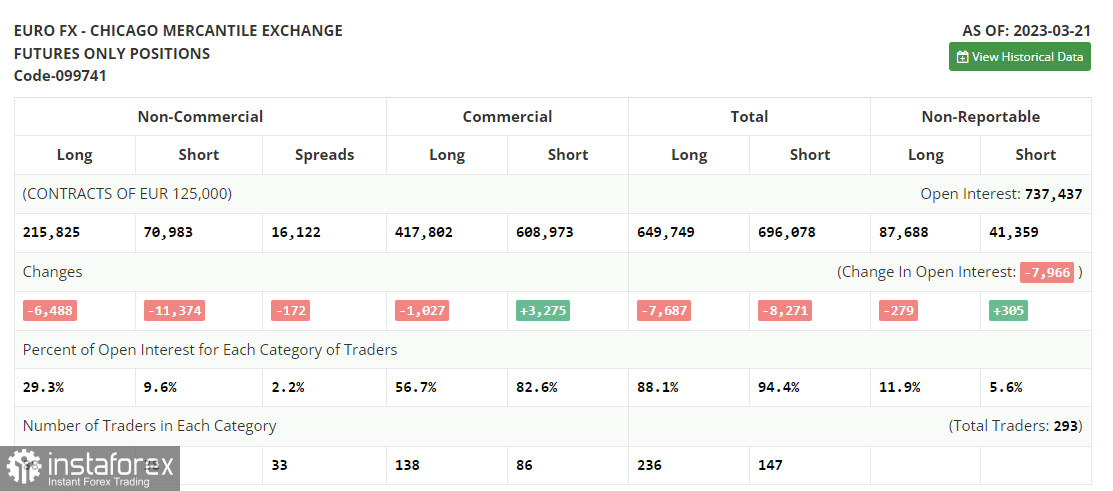
According to the COT report from March 21, the number of both long and short positions dropped. The Fed's meeting held in March affected the market situation. However, the US dollar is unlikely to slump since the regulator remained stuck to its policy. The aggressive approach of the ECB is the only fact that is supporting the euro at the moment. The central bank is planning to raise the key interest rate higher without altering its stance. Thus, the COT report unveiled that the number of long non-commercial positions decreased by 6,488 to 215,825, while the number of short non-commercial positions fell by 11,374 to 70,983. At the end of the week, the total non-commercial net position increased to 144,842 against 139,956. The weekly closing price rose to 1.0821 against 1.0803.

This image is no longer relevant

Indicators' signals:

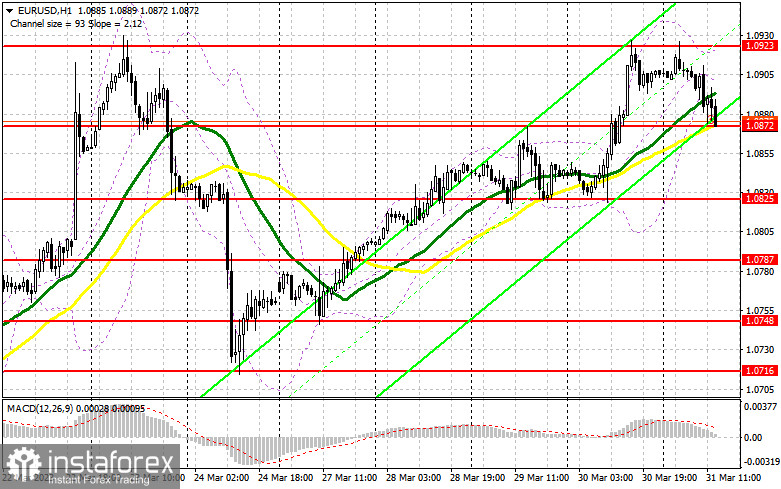
Trading is carried out near the 30 and 50 daily moving averages, which indicates a sideways movement.

Moving averages

Note: The period and prices of moving averages are considered by the author on the H1 (1-hour) chart and differ from the general definition of the classic daily moving averages on the daily D1 chart.

Bollinger Bands

If EUR/USD rises, the indicator's upper border at 1.0923 will serve as resistance.

Description of indicators

  • Moving average (moving average, determines the current trend by smoothing out volatility and noise). Period 50. It is marked yellow on the chart.
  • Moving average (moving average, determines the current trend by smoothing out volatility and noise). Period 30. It is marked green on the chart.
  • MACD indicator (Moving Average Convergence/Divergence - convergence/divergence of moving averages) Quick EMA period 12. Slow EMA period to 26. SMA period 9
  • Bollinger Bands (Bollinger Bands). Period 20
  • Non-commercial speculative traders, such as individual traders, hedge funds, and large institutions that use the futures market for speculative purposes and meet certain requirements.
  • Long non-commercial positions represent the total long open position of non-commercial traders.
  • Short non-commercial positions represent the total short open position of non-commercial traders.
  • Total non-commercial net position is the difference between the short and long positions of non-commercial traders.
เลือกช่วงเวลา
5
นาที
15
นาที
30
นาที
1
ชั่วโมง
4
ชั่วโมง
1
วัน
1
สัปดาห์
รับผลกำไรจากการเปลี่ยนแปลงอัตราสกุลเงินดิจิทัลกับ InstaForex.
ดาวน์โหลด MetaTrader 4 และเปิดการซื้อขายครั้งแรกของคุณ.
  • Grand Choice
    Contest by
    InstaForex
    InstaForex always strives to help you
    fulfill your biggest dreams.
    เข้าร่วมการแข่งขัน


บทความแนะนำ

คำแนะนำและการวิเคราะห์การซื้อขายสำหรับ GBP/USD ประจำวันที่ 9 มิถุนายน: เงินปอนด์เปลี่ยนแนวโน้มอีกครั้ง

เมื่อวันศุกร์ คู่สกุลเงิน GBP/USD มีการซื้อขายต่ำลง และเนื่องจากเส้นแนวโน้มอยู่ใกล้กับราคามาก แม้แต่การลดลงเพียงเล็กน้อยก็เพียงพอที่จะทะลุผ่าน Recall that 10 days ago, the pound sterling showed

Paolo Greco 03:33 2025-06-09 UTC+2

คำแนะนำและการวิเคราะห์การเทรดสำหรับ EUR/USD ประจำวันที่ 9 มิถุนายน: ครั้งนี้ดอลลาร์จะเติบโตได้นานแค่ไหน?

ในวันศุกร์ คู่สกุลเงิน EUR/USD ยังคงลดลงอย่างต่อเนื่องแต่ค่อนข้าง mild และสิ้นสุดวันที่ใกล้กับเส้นแนวโน้มขาขึ้นที่คุ้นเคย จำได้ว่าเมื่อประมาณ 10 วันก่อน เส้นนี้ถูกทำลาย สัญญาณว่าสิ้นสุดแนวโน้มขาขึ้น อย่างไรก็ตาม พื้นฐานที่เกี่ยวข้องกับความขัดแย้งทางการค้าของ Donald Trump

Paolo Greco 03:33 2025-06-09 UTC+2

GBP/USD: แผนการเทรดสำหรับเซสชั่นอเมริกา วันที่ 6 มิถุนายน (รีวิวการเทรดช่วงเช้า)

ในการพยากรณ์เมื่อเช้าของฉัน ฉันได้เน้นย้ำถึงระดับ 1.3544 และวางแผนที่จะทำการตัดสินใจเข้าตลาดบนพื้นฐานดังกล่าว ลองดูที่กราฟ 5 นาทีและดูว่าเกิดอะไรขึ้น มีการลดลงไปยังระดับ 1.3544 ตามด้วยการฝ่าวงล้อมลวง ซึ่งให้โอกาสในการซื้อปอนด์ แต่ไม่มีการเติบโตที่มีนัยสำคัญเกิดขึ้น ภาพทางเทคนิคไม่ได้รับการแก้ไขในช่วงครึ่งหลังของวัน ขณะนี้ทุกอย่างขึ้นอยู่กับข้อมูลตลาดแรงงานสหรัฐ หากการเติบโตของการจ้างงานนอกภาคเกษตรเกินคาดการณ์ของนักเศรษฐศาสตร์

Miroslaw Bawulski 15:38 2025-06-06 UTC+2

EUR/USD: แผนการซื้อขายสำหรับช่วงการซื้อขายในสหรัฐอเมริกา วันที่ 6 มิถุนายน (การทบทวนการซื้อขายในช่วงเช้า)

ในพยากรณ์ภาคเช้าของฉัน ฉันได้เน้นที่ระดับ 1.1407 และวางแผนการตัดสินใจเข้าตลาดบนพื้นฐานนี้ มาดูกราฟ 5 นาทีแล้วดูว่าเกิดอะไรขึ้น มีการลดลงไปที่ระดับ 1.1407 แต่ไม่มีการทะลุปลอมรูปเกิดขึ้น ภาพทางเทคนิคไม่ได้ปรับปรุงสำหรับครึ่งหลังของวัน แม้ว่าข้อมูล GDP ของยูโรโซนที่ถูกปรับขึ้นจะส่งผลดี แต่เทรดเดอร์ยังคงรอคอยการซื้อขายอย่างระมัดระวัง

Miroslaw Bawulski 15:36 2025-06-06 UTC+2

จะเทรดคู่สกุลเงิน GBP/USD อย่างไรในวันที่ 6 มิถุนายน? เคล็ดลับง่ายๆ และการวิเคราะห์การเทรดสำหรับมือใหม่

วิเคราะห์การซื้อขายวันพฤหัสบดี: GBP/USD บนแผนภูมิ 1 ชั่วโมง คู่เงิน GBP/USD ยังคงขยับตัวขึ้นต่อในวันพฤหัสบดี แม้ว่าจะมีเหตุผลที่น้อยกว่าคู่เงิน EUR/USD ก็ตาม ไม่มีข่าวหรือการประกาศใดๆ ที่เกี่ยวข้องกับเงินปอนด์อังกฤษเลยในเมื่อวานนี้ อย่างไรก็ตาม เงินยูโรเพิ่มขึ้นตามการประชุม

Paolo Greco 09:57 2025-06-06 UTC+2

วิธีการเทรดคู่สกุลเงิน EUR/USD ในวันที่ 6 มิถุนายน? เคล็ดลับง่ายๆ และการวิเคราะห์การเทรดสำหรับมือใหม่

คู่สกุลเงิน EUR/USD ยังคงเคลื่อนไหวขึ้นในวันพฤหัสบดี สอดคล้องกับแนวโน้มปัจจุบัน โดยไม่มีเหตุผลชัดเจนที่จะทำให้สกุลเงินยุโรปเกิด "การพุ่งขึ้น" ใหม่ เหตุการณ์หลักเดียวในวันพฤหัสบดีคือการประชุมของ ECB หลังจากการประชุมนี้ ยูโรมีการเพิ่มขึ้นที่ค่อนข้างแข็งแกร่ง แต่สุดท้ายก็ลดลง อย่างไรก็ตาม ยูโรได้เพิ่มขึ้นในครั้งแรก

Paolo Greco 09:51 2025-06-06 UTC+2

คำแนะนำการซื้อขายและการวิเคราะห์การค้า สำหรับ GBP/USD วันที่ 6 มิถุนายน 2025

คู่สกุลเงิน GBP/USD ยังคงเคลื่อนไหวในทิศทางขาขึ้นในวันพฤหัสบดี แม้ว่าจะไม่มีเหตุผลที่ชัดเจนสำหรับการเคลื่อนไหวนี้ ปอนด์อังกฤษยังคงเพิ่มขึ้นเกือบทุกๆ โอกาส — หรือแม้แต่ไม่มีเหตุผล ถ้ามีข่าวที่สนับสนุนปอนด์หรือไม่สนับสนุนดอลลาร์ ปอนด์ก็จะขึ้น ถ้าไม่มีข่าวใดๆ น่าสนใจ ปอนด์ก็จะคงที่ ถ้ายูโรเพิ่มขึ้น ปอนด์ก็เพิ่มขึ้นตาม

Paolo Greco 04:43 2025-06-06 UTC+2

คำแนะนำการซื้อขายและการวิเคราะห์การซื้อขายสำหรับ EUR/USD วันที่ 6 มิถุนายน 2025

คู่สกุลเงิน EUR/USD ยังคงซื้อขายอยู่ในขาขึ้นในวันพฤหัสบดี แม้จะเป็นการผ่อนมาตรการทางการเงินครั้งล่าสุดจาก ECB แต่ก็ไม่สามารถช่วยดอลลาร์ได้ เมื่อวานนี้ หน่วยงานกำกับดูแลของยุโรปได้ตัดสินใจเป็นครั้งที่แปดในการลดอัตราดอกเบี้ยที่สำคัญทั้งสาม ซึ่งแน่นอนว่าเป็นการตัดสินใจในเชิง "ผ่อนคลาย" และเป็นปัจจัย "ขาลง" สำหรับยูโร อย่างไรก็ตาม ยูโรไม่ได้รู้สึกถึงความไม่สะดวกจากสถานการณ์นี้เลย

Paolo Greco 04:26 2025-06-06 UTC+2

GBP/USD: แผนการเทรดสำหรับเซสชันสหรัฐวันที่ 5 มิถุนายน (รีวิวการเทรดช่วงเช้า)

ในการคาดการณ์ช่วงเช้าของฉัน ฉันได้มุ่งเน้นไปที่ระดับ 1.3562 และวางแผนการตัดสินใจเข้าตลาดรอบ ๆ ระดับนี้ ลองมาดูที่กราฟ 5 นาทีและดูว่าเกิดอะไรขึ้น การเติบโตและการเกิดเหตุตีความผิดรอบ ๆ ระดับ 1.3562 นำไปสู่จุดเริ่มต้นในการขายเงินปอนด์ แต่ตามที่คุณเห็นในกราฟ

Miroslaw Bawulski 19:46 2025-06-05 UTC+2

EUR/USD: แผนการซื้อขายสำหรับช่วงเวลาของสหรัฐวันที่ 5 มิถุนายน (รีวิวการซื้อขายในช่วงเช้า)

ในการคาดการณ์ช่วงเช้าของฉัน ฉันได้เน้นที่ระดับ 1.1407 และวางแผนที่จะตัดสินใจเข้าสู่ตลาดรอบระดับนี้ มาดูกราฟ 5 นาทีและวิเคราะห์สิ่งที่เกิดขึ้น การลดลงและการก่อตัวของการฝ่าทะลุที่ผิดพลาดรอบๆ 1.1407 ได้ให้จุดเริ่มต้นในการซื้อยูโร แต่ตามที่เห็นในกราฟ การทะยานขึ้นครั้งใหญ่ของคู่สกุลเงินนี้ไม่ได้เกิดขึ้น รูปภาพทางเทคนิคไม่ได้รับการแก้ไขสำหรับครึ่งหลังของวัน สำหรับการเปิดสถานะ Long

Miroslaw Bawulski 19:39 2025-06-05 UTC+2
หากไม่สะดวกคุยในตอนนี้
ระบุคำถามไว้ได้ใน แชท.
Widget callback
 

Dear visitor,

Your IP address shows that you are currently located in the USA. If you are a resident of the United States, you are prohibited from using the services of InstaFintech Group including online trading, online transfers, deposit/withdrawal of funds, etc.

If you think you are seeing this message by mistake and your location is not the US, kindly proceed to the website. Otherwise, you must leave the website in order to comply with government restrictions.

Why does your IP address show your location as the USA?

  • - you are using a VPN provided by a hosting company based in the United States;
  • - your IP does not have proper WHOIS records;
  • - an error occurred in the WHOIS geolocation database.

Please confirm whether you are a US resident or not by clicking the relevant button below. If you choose the wrong option, being a US resident, you will not be able to open an account with InstaForex anyway.

We are sorry for any inconvenience caused by this message.