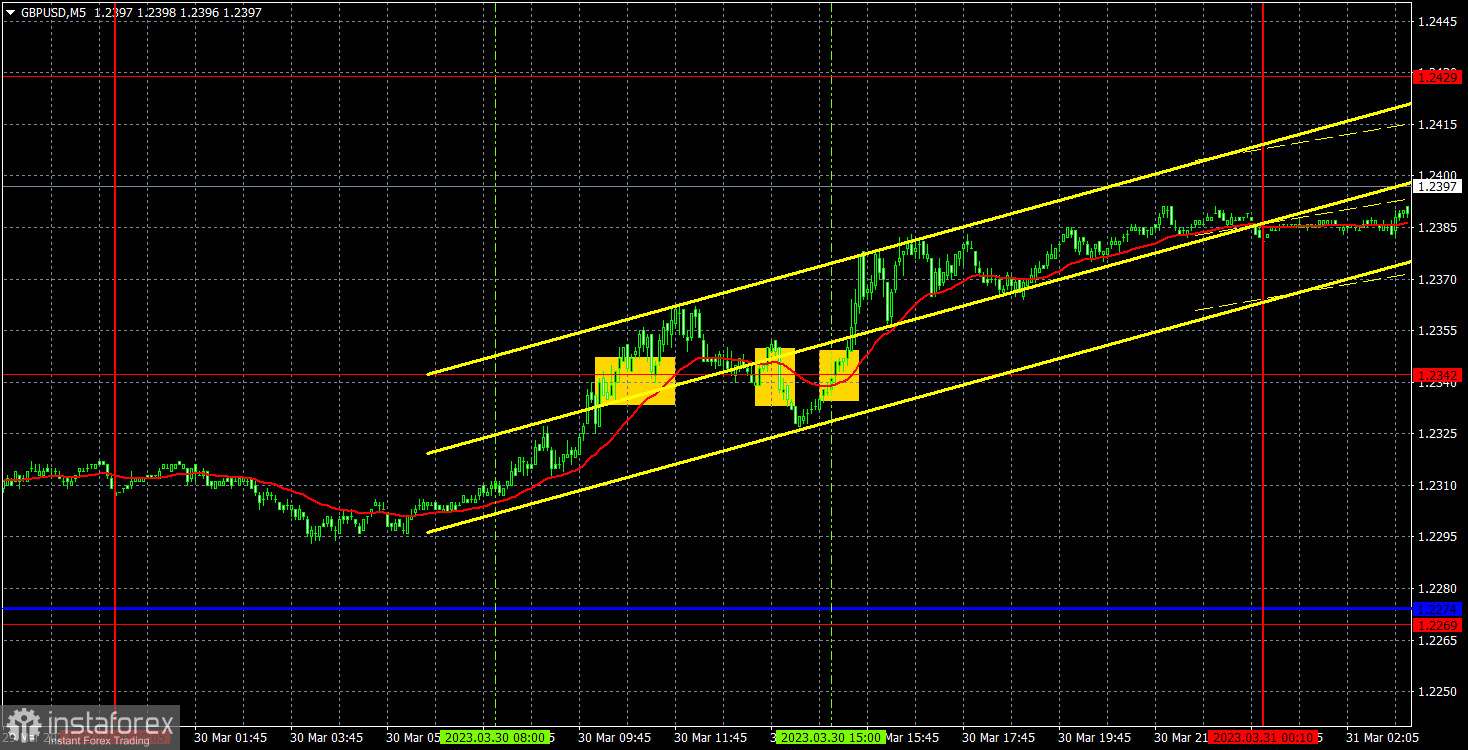
empty
31.03.2023 08:05 AM
GBP/USD: Forecast and trading signals on March 31. COT report. Detailed analysis of price movement and trades. The moment of truth for the pound

5M chart of GBP/USD

This image is no longer relevant

On Thursday, GBP/USD also stretched its upward movement. Volatility was not as strong as the euro, and the pound did not have any reasons to rise at all. If the German inflation report had little to do with the euro, then it certainly had nothing to do with the pound. Nevertheless, the British currency still rose. But is anyone even surprised? The US published its Q4 GDP report, but there was nothing surprising about it and the values completely matched the forecasts. Besides, the report was released in the afternoon, while the pound was already rising in the morning. It's not even necessary to talk about the fact that the US economy showed strong growth in Q4, which should have triggered the dollar's growth. Thus, the pound continues to rise for no reason in the short term. It has already come close to 1.2440, which is the upper limit of the horizontal channel on the 24-hour view. There might be a pullback and not a less strong fall from it.

There were three trading signals on Thursday, all three of which were false because the pair decided to take a break near 1.2342. Traders could work out only the first two signals, but this, in principle, does not really matter, because the price did not even pass the right direction by 20 points in both cases.
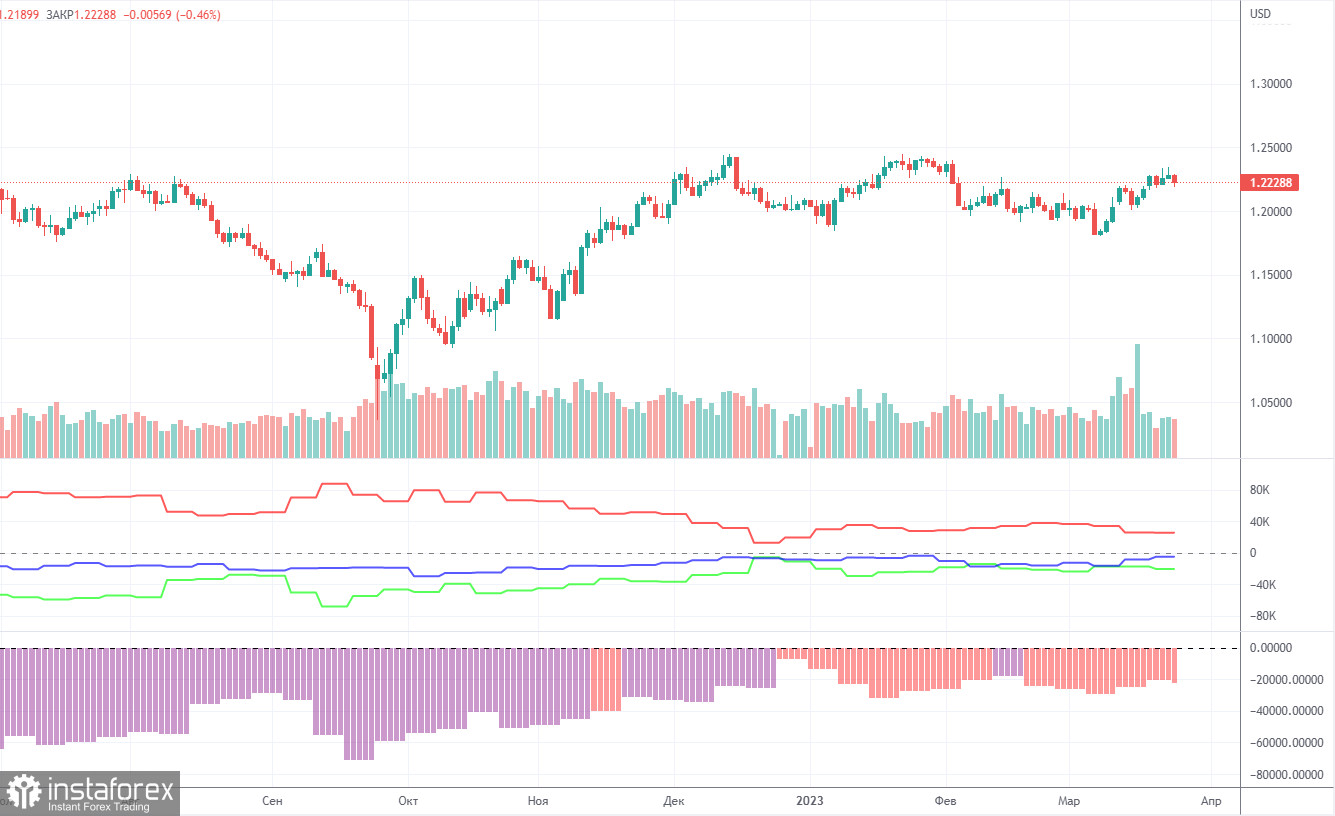
COT report:

This image is no longer relevant

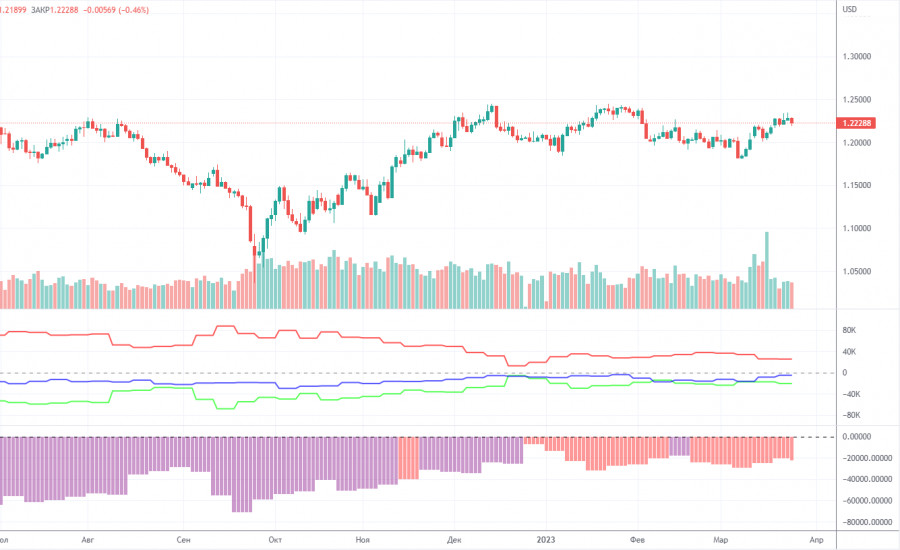
For the British pound, the Commodity Futures Trading Commission has caught up with the lost time and has now released reports exactly on time. The last report available is for March 21. According to that report, the non-commercial group closed 3,700 long positions and 500 short ones. Thus, the net position of non-commercial traders decreased by 3,200 but continues to grow. The net position indicator has been steadily growing over the past months but the mood of major traders still remains bearish. Although the pound sterling is growing against the dollar (in the medium term), it is very difficult to answer the question why it is doing this from a fundamental point of view. It is quite possible that the pound sterling may slump in the near future. Formally, it has already begun its downward movement but so far it looks more like a flat. Notably, both major pairs are moving similarly at the moment. However, the net position for the euro is positive and even implies the imminent completion of the upward momentum, whereas for the pound it is negative, which gives rise to expectations of further growth. But at the same time, the pound has already grown by 2100 points, which is a lot, and without a strong bearish correction the continuation of the growth will be absolutely illogical. The non-commercial group opened a total of 49,000 shorts and 28,000 longs. We remain skeptical about the long-term growth in the British currency and expect it to fall deeper.
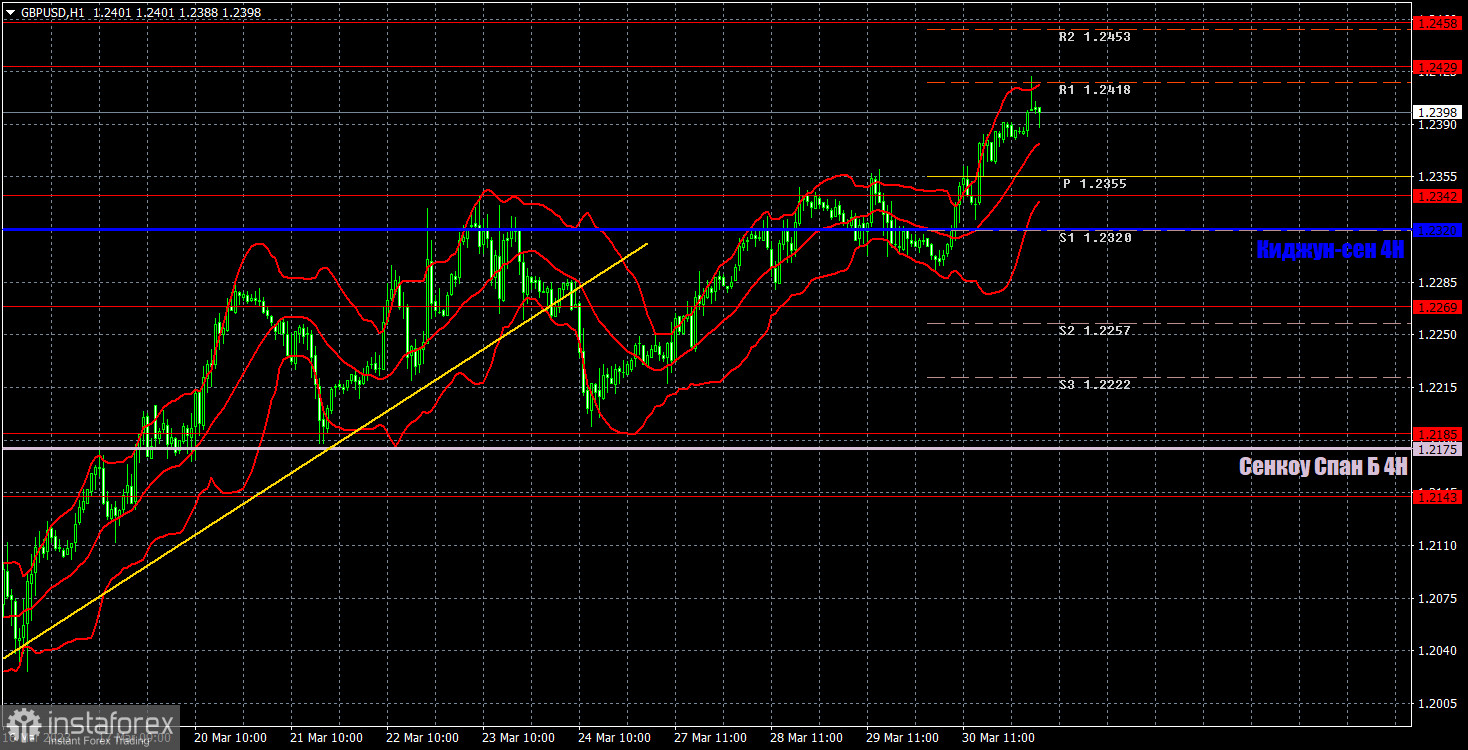
1H chart of GBP/USD

This image is no longer relevant

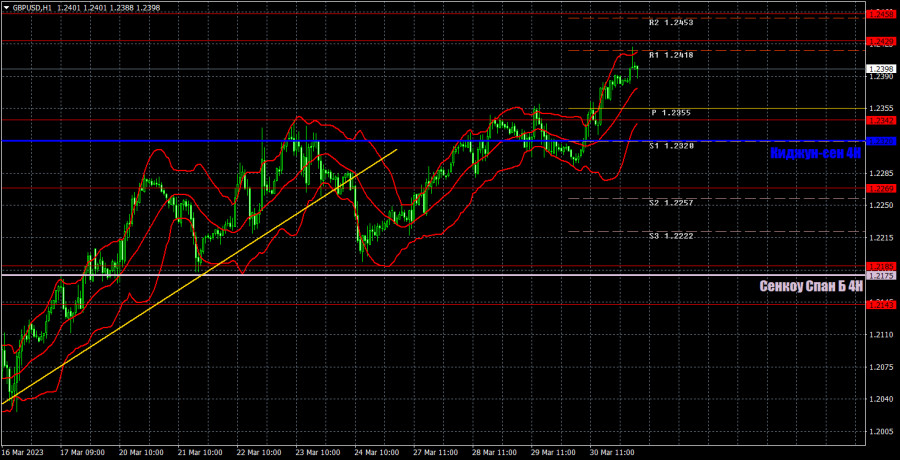
On the one-hour chart, GBP/USD has overcome the trend line, but easily resumed the uptrend and rose for the fifth straight day. The pair continues to rise and it doesn't stop. So far it can be written off as a horizontal channel in the 24-hours view, but overcoming 1.2440 will bring the pair out of the flat on the daily chart. So, the "moment of truth" is coming. On March 31, it is recommended to trade at the key level of 1.1927, 1.1965, 1.2143, 1.2185, 1.2269, 1.2342, 1.2429-1.2458, 1.2589, 1.2659. The Senkou Span B (1.2175) and Kijun Sen (1.2320) lines can also generate signals. Rebounds and breakouts from these lines can also serve as trading signals. It is better to set the Stop Loss at breakeven as soon as the price moves by 20 pips in the right direction. The lines of the Ichimoku indicator can change their position throughout the day which is worth keeping in mind when looking for trading signals. The first report of the week will finally be released in the U.K. - fourth quarter GDP. In the US, there is just some minor data which is unlikely to affect traders' mood. As a whole, all of today's reports are unlikely to influence traders' desire to buy.

Indicators on charts:

Resistance/support - thick red lines, near which the trend may stop. They do not make trading signals.

Kijun-sen and Senkou Span B are the Ichimoku indicator lines moved to the hourly timeframe from the 4-hour timeframe. They are also strong lines.

Extreme levels are thin red lines, from which the price used to bounce earlier. They can produce trading signals.

Yellow lines are trend lines, trend channels, and any other technical patterns.

Indicator 1 on the COT chart is the size of the net position of each trader category.

Indicator 2 on the COT chart is the size of the net position for the Non-commercial group of traders.

Paolo Greco,
ผู้เชี่ยวชาญด้านการวิเคราะห์ของ InstaForex
© 2007-2025
เลือกช่วงเวลา
5
นาที
15
นาที
30
นาที
1
ชั่วโมง
4
ชั่วโมง
1
วัน
1
สัปดาห์
รับผลกำไรจากการเปลี่ยนแปลงอัตราสกุลเงินดิจิทัลกับ InstaForex.
ดาวน์โหลด MetaTrader 4 และเปิดการซื้อขายครั้งแรกของคุณ.
  • Grand Choice
    Contest by
    InstaForex
    InstaForex always strives to help you
    fulfill your biggest dreams.
    เข้าร่วมการแข่งขัน


บทความแนะนำ

คำแนะนำและการวิเคราะห์การซื้อขายสำหรับ GBP/USD เมื่อวันที่ 10 มิถุนายน: เงินปอนด์ยังไม่รีบร้อนที่จะตกเช่นกัน

ในวันจันทร์ คู่สกุลเงิน GBP/USD ไม่สามารถดำเนินต่อไปในทิศทางขาลงได้ตามที่คาดการณ์ไว้ ย้อนกลับไปก่อนหน้านี้ ราคามีการส่งสัญญาณกลับตัวของแนวโน้มไปเป็นขาลงอีกครั้ง—การยืนยันต่ำกว่าบรรทัดแนวโน้มที่กำลังขึ้น และก่อนหน้านี้—อีกสัญญาณหนึ่ง—การออกจากช่องที่กำลังขึ้น ขณะนี้ยังไม่มีสัญญาณใดที่นำไปสู่การลดลงของคู่สกุลเงิน ด้วยเหตุนี้ ตลาดยังไม่ได้รีบเร่งที่จะซื้อดอลลาร์สหรัฐ ค่าเงินปอนด์ของอังกฤษยังคงใช้ประโยชน์จากสถานการณ์ปัจจุบันนี้ ควรจำไว้ว่าไม่มีเหตุผลใดๆ ที่แท้จริงที่ทำให้ค่าเงินปอนด์เพิ่มขึ้นในขณะนี้ ซึ่งต่างจากธนาคารกลางสหรัฐ (Federal

Paolo Greco 04:11 2025-06-10 UTC+2

คำแนะนำและการวิเคราะห์การเทรดสำหรับ EUR/USD ในวันที่ 10 มิถุนายน: อีกหนึ่งวันกับความรู้สึกเชิงลบที่เพิ่มขึ้น

คู่สกุลเงิน EUR/USD ทำการซื้อขายแบบผสมในวันจันทร์ แม้ว่าจะสามารถทะลุเส้นแนวโน้มไปได้ แต่การเคลื่อนตัวลง (หมายถึงการแข็งค่าของเงินดอลลาร์สหรัฐ) ก็ยังไม่เริ่มต้นขึ้นจริง ด้วยเหตุนี้ สัญญาณทางเทคนิคยังคงมีความสำคัญน้อยสำหรับเทรดเดอร์ เช่นเดียวกับปัจจัยอื่นๆ ที่ไม่เกี่ยวข้องกับ Donald Trump เราต้องการจะบอกว่าตลาดยังคงให้ความสำคัญกับสงครามการค้า และจากนี้จึงมองข้ามสกุลเงินสหรัฐ

Paolo Greco 04:11 2025-06-10 UTC+2

GBP/USD: แผนการเทรดสำหรับช่วงตลาดสหรัฐในวันที่ 9 มิถุนายน (การวิเคราะห์การซื้อขายช่วงเช้า)

ในการพยากรณ์ช่วงเช้าของฉัน ฉันได้มุ่งเน้นไปที่ระดับ 1.3581 และวางแผนที่จะตัดสินใจเข้าเทรดโดยอิงจากระดับนี้ มาดูกราฟ 5 นาทีและดูว่าเกิดอะไรขึ้น การขึ้นและเกิดการเบรกเอาท์หลอกที่ระดับนี้นำไปสู่จุดเข้าในการขายปอนด์ แต่การลดลงอย่างมากไม่ได้เกิดขึ้น ภาพทางเทคนิคยังคงไม่เปลี่ยนแปลงในช่วงครึ่งหลังของวัน การเปิดสถานะยาว (Long Position) บนคู่สกุลเงิน GBP/USD

Miroslaw Bawulski 14:16 2025-06-09 UTC+2

EUR/USD: แผนการเทรดสำหรับตลาดการซื้อขายของสหรัฐฯ ในวันที่ 9 มิถุนายน (การวิเคราะห์การซื้อขายช่วงเช้า)

ในบทวิเคราะห์ช่วงเช้าของฉัน ฉันได้เน้นไปที่ระดับ 1.1430 และวางแผนตัดสินใจเข้าซื้อขายจากระดับนี้ ลองมาดูที่กราฟ 5 นาทีและดูว่าเกิดอะไรขึ้น คู่สกุลเงินนี้ได้ปรับตัวขึ้นและเกิดการเบรคเอ้าท์หลอกที่ระดับนี้ ซึ่งนำไปยังจุดเข้าขายยูโร อย่างไรก็ตาม หลังจากการปรับตัวลงมา 10 จุด การเคลื่อนไหวที่มีความหมายมากกว่านี้ไม่ได้เกิดขึ้น ภาพทางเทคนิคนั้นยังคงไม่เปลี่ยนแปลงสำหรับครึ่งหลังของวัน

Miroslaw Bawulski 14:09 2025-06-09 UTC+2

วิธีการเทรดคู่สกุลเงิน GBP/USD ในวันที่ 9 มิถุนายน? เคล็ดลับง่ายๆ และการวิเคราะห์การเทรดสำหรับผู้เริ่มต้น

คู่เงิน GBP/USD ก็มีการซื้อขายลดลงในวันศุกร์ด้วยเหตุผลเดียวกันกับคู่เงิน EUR/USD ดอลลาร์ได้รับการสนับสนุนจากตลาดน้อยมากแม้ว่าจะมีข้อมูลเศรษฐกิจมหภาคที่ดีจากต่างประเทศ แต่การเติบโตนี้ไม่ได้เปิดโอกาสใหม่ ๆ น่าเสียดายที่สกุลเงินสหรัฐยังคงถูกกดดันจากนโยบายการค้าของ Donald Trump และตลาดก็มีท่าทีไม่สนใจดอลลาร์อย่างชัดเจน มีเพียงไม่กี่ผู้ที่ยอมเสี่ยงลงทุนในดอลลาร์หรือเศรษฐกิจอเมริกันท่ามกลางความไม่แน่นอนทางเศรษฐกิจอย่างสมบูรณ์ ซึ่งสมาชิกทั้งหมดของคณะกรรมการนโยบายการเงินของธนาคารกลางสหรัฐก็ยอมรับอย่างเปิดเผย จากมุมมองทางเทคนิค ราคามีการยืนต่ำกว่าแนวโน้มขาขึ้นใหม่

Paolo Greco 05:54 2025-06-09 UTC+2

วิธีการเทรดคู่สกุลเงิน EUR/USD วันที่ 9 มิถุนายน? เคล็ด(ไม่)ลับและวิเคราะห์การเทรดสำหรับมือใหม่

คู่สกุลเงิน EUR/USD มีการซื้อขายลดลงในวันศุกร์ และมีเหตุผลที่ชัดเจนสำหรับเรื่องนี้ อย่างไรก็ตาม สิ่งสำคัญคือต้องสังเกตว่าเมื่อสิ้นสุดวัน ดอลลาร์แข็งค่าเพิ่มขึ้น "เต็ม" 50 พิปส์ จะบอกว่า 50 พิปส์ไม่สำคัญก็ไม่ถูกต้อง โดยเฉพาะอย่างยิ่งเมื่อพิจารณาว่าการเติบโตนี้เกิดขึ้นพร้อมกับข้อมูลที่ค่อนข้างดีและสำคัญจากฝั่งอเมริกา รายงาน

Paolo Greco 05:54 2025-06-09 UTC+2

คำแนะนำและการวิเคราะห์การซื้อขายสำหรับ GBP/USD ประจำวันที่ 9 มิถุนายน: เงินปอนด์เปลี่ยนแนวโน้มอีกครั้ง

เมื่อวันศุกร์ คู่สกุลเงิน GBP/USD มีการซื้อขายต่ำลง และเนื่องจากเส้นแนวโน้มอยู่ใกล้กับราคามาก แม้แต่การลดลงเพียงเล็กน้อยก็เพียงพอที่จะทะลุผ่าน Recall that 10 days ago, the pound sterling showed

Paolo Greco 03:33 2025-06-09 UTC+2

คำแนะนำและการวิเคราะห์การเทรดสำหรับ EUR/USD ประจำวันที่ 9 มิถุนายน: ครั้งนี้ดอลลาร์จะเติบโตได้นานแค่ไหน?

ในวันศุกร์ คู่สกุลเงิน EUR/USD ยังคงลดลงอย่างต่อเนื่องแต่ค่อนข้าง mild และสิ้นสุดวันที่ใกล้กับเส้นแนวโน้มขาขึ้นที่คุ้นเคย จำได้ว่าเมื่อประมาณ 10 วันก่อน เส้นนี้ถูกทำลาย สัญญาณว่าสิ้นสุดแนวโน้มขาขึ้น อย่างไรก็ตาม พื้นฐานที่เกี่ยวข้องกับความขัดแย้งทางการค้าของ Donald Trump

Paolo Greco 03:33 2025-06-09 UTC+2

GBP/USD: แผนการเทรดสำหรับเซสชั่นอเมริกา วันที่ 6 มิถุนายน (รีวิวการเทรดช่วงเช้า)

ในการพยากรณ์เมื่อเช้าของฉัน ฉันได้เน้นย้ำถึงระดับ 1.3544 และวางแผนที่จะทำการตัดสินใจเข้าตลาดบนพื้นฐานดังกล่าว ลองดูที่กราฟ 5 นาทีและดูว่าเกิดอะไรขึ้น มีการลดลงไปยังระดับ 1.3544 ตามด้วยการฝ่าวงล้อมลวง ซึ่งให้โอกาสในการซื้อปอนด์ แต่ไม่มีการเติบโตที่มีนัยสำคัญเกิดขึ้น ภาพทางเทคนิคไม่ได้รับการแก้ไขในช่วงครึ่งหลังของวัน ขณะนี้ทุกอย่างขึ้นอยู่กับข้อมูลตลาดแรงงานสหรัฐ หากการเติบโตของการจ้างงานนอกภาคเกษตรเกินคาดการณ์ของนักเศรษฐศาสตร์

Miroslaw Bawulski 15:38 2025-06-06 UTC+2

EUR/USD: แผนการซื้อขายสำหรับช่วงการซื้อขายในสหรัฐอเมริกา วันที่ 6 มิถุนายน (การทบทวนการซื้อขายในช่วงเช้า)

ในพยากรณ์ภาคเช้าของฉัน ฉันได้เน้นที่ระดับ 1.1407 และวางแผนการตัดสินใจเข้าตลาดบนพื้นฐานนี้ มาดูกราฟ 5 นาทีแล้วดูว่าเกิดอะไรขึ้น มีการลดลงไปที่ระดับ 1.1407 แต่ไม่มีการทะลุปลอมรูปเกิดขึ้น ภาพทางเทคนิคไม่ได้ปรับปรุงสำหรับครึ่งหลังของวัน แม้ว่าข้อมูล GDP ของยูโรโซนที่ถูกปรับขึ้นจะส่งผลดี แต่เทรดเดอร์ยังคงรอคอยการซื้อขายอย่างระมัดระวัง

Miroslaw Bawulski 15:36 2025-06-06 UTC+2
หากไม่สะดวกคุยในตอนนี้
ระบุคำถามไว้ได้ใน แชท.
Widget callback
 

Dear visitor,

Your IP address shows that you are currently located in the USA. If you are a resident of the United States, you are prohibited from using the services of InstaFintech Group including online trading, online transfers, deposit/withdrawal of funds, etc.

If you think you are seeing this message by mistake and your location is not the US, kindly proceed to the website. Otherwise, you must leave the website in order to comply with government restrictions.

Why does your IP address show your location as the USA?

  • - you are using a VPN provided by a hosting company based in the United States;
  • - your IP does not have proper WHOIS records;
  • - an error occurred in the WHOIS geolocation database.

Please confirm whether you are a US resident or not by clicking the relevant button below. If you choose the wrong option, being a US resident, you will not be able to open an account with InstaForex anyway.

We are sorry for any inconvenience caused by this message.