empty
20.03.2023 02:04 PM
Technical analysis of GBP/USD for March 20, 2023

This image is no longer relevant

Overview :

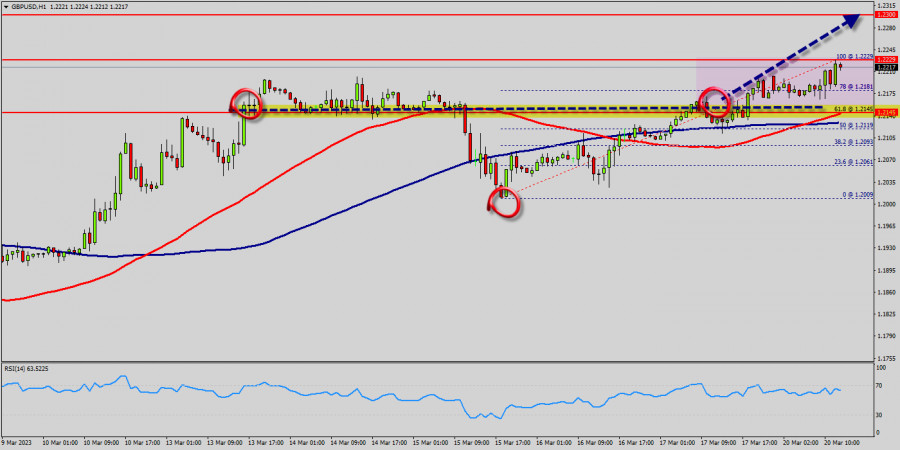
The GBP/USD pair traded higher and closed the day in the positive territory near the price of 1.2208. Right now, it was trading in a narrow range of 1.2150 staying close to a 2-days high. On the hourly chart, the GBP/USD pair is still trading above the MA (100) H1 moving average line (1.2068 - weekly pivot point). The situation is similar on the 4-hour chart. Based on the foregoing, it is probably worth sticking to the north direction in trading, and as long as the GBP/USD pair remains above MA 100 H1, it may be necessary to look for entry points to buy for the formation of a correction.

All elements being clearly bullish, it would be possible for traders to trade only long positions on the GBP/USD pair as long as the price remains well above the golden ratio of 1.2068. The buyers' bullish objective is set at 1.2209.

The price is likely to form a double top in the same time frame. Accordingly, the GBP/USD pair is showing signs of strength following a breakout of the highest level of 1.2209. So, buy above the level of 1.2068 with the first target at 1.2209 in order to test the daily resistance 1. The level of 1.2209 is a good place to take profits.

Moreover, the RSI is still signaling that the trend is upward as it remains strong above the moving average (100). This suggests that the pair will probably go up in coming hours. A bullish break in this resistance would boost the bullish momentum. Other outlook for the GBP/USD pair : Pound Sterling is currently trading at 1.2150. If the trend reverses from this point, then a possible future share price target could be 1.2209.

If the price of Pound Sterling is trading above 1.2150 then possibility of upside targets getting achieved is higher around the level of 1.2150. The basic bullish trend is very strong on the GBP/USD pair, but the short term shows some signs of running out of steam. Nevertheless, a purchase could be considered as long as the price remains above 1.2150.

Crossing the first resistance at 1.2209 would be a sign of a potential new surge in the price. Buyers would then use the next resistance located at 1.2270 as an objective. Crossing it would then enable buyers to target 1.2270. Caution, a return to below 1.2270 would be a sign of a consolidation phase in the short-term basic trend. If this is the case, remember that trading against the trend may be riskier.

It would seem more appropriate to wait for a signal indicating reversal of the trend. In the very short term, the general bullish sentiment is not called into question, despite technical indicators being indecisive. All elements being clearly bullish market, it would be possible for traders to trade only long positions on the GBP/USD pair as long as the price remains well above the price of 1.2068. The GBP/USD pair will continue rising from the level of 1.2068 in the long term.

It should be noted that the support is established at the level of 1.2068 which represents the last bearish wave. The price is likely to form a double bottom in the same time frame. Accordingly, the GBP/USD pair is showing signs of strength following a breakout of the highest level of 1.2068. So, buy above the level of 1.2068 with the first target at 1.2209 in order to test the daily resistance 1. The buyers' bullish objective is set at the level of 1.2270 (last bullish wave). A bullish break in this resistance would boost the bullish momentum.

The buyers could then target the resistance located at 1.2270 . This suggests that the pair will probably go up in coming hours. If the trend is able to break the level of 1.2209 (double top), then the market will call for a strong bullish market towards the objective of 1.2270 this week. If there is any crossing, the next objective would be the resistance located at 1.2270.

The level of 1.2270 is a good place to take profits. Moreover, the RSI is still signaling that the trend is upward as it remains strong above the moving average (100). Since the trend is above the 61.8% Fibonacci level (1.2068), it means the market is still in a uptrend. From this point, the GBP/USD pair is continuing in a bullish trend from the new support of 1.2068. This is shown to us as the current price is in a bullish channel.

According to the previous events, we expect that the GBP/USD pair will move between 1.2068 and 1.2270 in coming hours. It is also should be noted, beware of bullish excesses that could lead to a possible short-term correction; but this possible correction would not be tradeable.

On the other hand, in case a reversal takes place and the GBP/USD pair breaks through the support level of 1.2068, a further decline to 1.1981 can occur. It would indicate a bearish market.

เลือกช่วงเวลา
5
นาที
15
นาที
30
นาที
1
ชั่วโมง
4
ชั่วโมง
1
วัน
1
สัปดาห์
รับผลกำไรจากการเปลี่ยนแปลงอัตราสกุลเงินดิจิทัลกับ InstaForex.
ดาวน์โหลด MetaTrader 4 และเปิดการซื้อขายครั้งแรกของคุณ.
วิธีการเทรดคู่สกุลเงิน EUR/USD ในวันที่ 4 กรกฎาคม? เคล็ดลับง่ายๆ และการวิเคราะห์การเทรดสำหรับผู้เริ่มต้น คู่สกุลเงิน EUR/USD ได้มีการซื้อขายตลอดวันพฤหัสบดี ทั้งก่อนและหลังการประกาศข้อมูลการจ้างงานนอกภาคเกษตรและอัตราการว่างงานของสหรัฐฯ การเคลื่อนไหวของราคาอยู่ในรูปแบบแนวราบอย่างสมบูรณ์ทั้งก่อนและหลังการเผยแพร่ข้อมูลเศรษฐกิจมหภาคของสหรัฐฯ ทันทีที่รายงานถูกเผยแพร่ออกมา ราคาก็ลดลงอย่างรวดเร็ว แต่ภายในชั่วโมงถัดมา ราคาก็กลับฟื้นตัวขึ้นเกือบเต็มที่ อัตราการว่างงานของสหรัฐฯ ลดลงมาอยู่ที่ 4.1% ซึ่งขัดกับการคาดการณ์ และจำนวนการจ้างงานนอกภาคเกษตรเพิ่มขึ้น 147,000
  • Grand Choice
    Contest by
    InstaForex
    InstaForex always strives to help you
    fulfill your biggest dreams.
    เข้าร่วมการแข่งขัน


บทความแนะนำ

การคาดการณ์ EUR/USD สำหรับวันที่ 4 กรกฎาคม 2025

เหตุการณ์สำคัญของเมื่อวานส่วนใหญ่สอดคล้องกับคำทำนายของเรา — โดยเฉพาะอย่างยิ่ง "การแสดงตัวเลข" ที่คาดการณ์ไว้ได้เกิดขึ้นแล้ว แต่มันทำอย่างละเอียดพอที่จะแค่หยุดการเติบโตของสกุลเงินต่อต้านดอลลาร์เท่านั้น การคาดการณ์ครั้งแรกของ Nonfarm Payrolls โดย Reuters อยู่ที่ 120,000 แต่ในวันที่เผยแพร่ได้ลดลงเหลือ 111,000

Laurie Bailey 06:01 2025-07-04 UTC+2

การคาดการณ์สำหรับ GBP/USD ในวันที่ 4 กรกฎาคม 2025

บนกราฟรายวัน เงินปอนด์อังกฤษได้รวมตัวอยู่ต่ำกว่าเส้น MACD ซึ่งถือเป็นโอกาสที่ดีที่สามารถรวบรวมตัวต่ำกว่าระดับแนวรับที่ 1.3635 ได้ด้วย แต่ความพยายามนั้นล้มเหลว ทำให้การเคลื่อนไหวต่อไปสำหรับฝั่งขาลงซับซ้อนขึ้นเล็กน้อย แม้แต่ Marlin oscillator ชั้นนำก็ยังไม่พยายามเข้าใกล้เขตแดนกับแนวโน้มขาลง ในสถานการณ์เช่นนี้ ค่าเงินปอนด์อาจยังคงอยู่ในช่วงไซด์เวย์ไปอีกสองวัน อย่างไรก็ตาม

Laurie Bailey 05:58 2025-07-04 UTC+2

การคาดการณ์ก๊าซธรรมชาติสำหรับวันที่ 4 กรกฎาคม 2025

ก๊าซธรรมชาติ (NG) เส้นตัวชี้วัดสมดุลรายวันได้หยุดการพุ่งขึ้นของราคาที่เกิดขึ้นเมื่อวานนี้อย่างเด็ดขาด — วันพฤหัสบดีสิ้นสุดลงด้วยการลดลง 2.63% ในขณะที่การลดลงได้รับการหนุนโดยเส้น MACD การปิดที่ต่ำกว่าแนวต่ำของวันวานที่ 3.392 จะบ่งชี้ถึงการทะลุแนวรับของเส้น MACD ซึ่งจะเปิดทางไปสู่เป้าหมายที่ 3.086 หลังจากนั้นคาดว่าราคาจะลดลงต่อไปสู่ระดับเป้าหมาย

Laurie Bailey 05:53 2025-07-04 UTC+2

EUR/USD. วันที่ 3 กรกฎาคม: วันที่สำคัญที่สุดของสัปดาห์

เมื่อวันพุธ คู่สกุลเงิน EUR/USD ได้ดีดตัวขึ้นจากระดับ 1.1802 และกลับไปอีกครั้งในฝั่งของดอลลาร์สหรัฐฯ พร้อมกับมีการลดลงเล็กน้อย อย่างไรก็ตาม ในช่วงเช้าวันพฤหัสบดี คู่สกุลเงินดังกล่าวกลับมาที่ระดับ 1.1802 อีกครั้ง การดีดตัวเพิ่มเติมจากระดับนี้จะยังคงเป็นการสนับสนุนดอลลาร์และอาจส่งผลให้ลดลงต่อไปสู่ระดับ 127.2% ของระดับ

Samir Klishi 12:10 2025-07-03 UTC+2

GBP/USD. ค่าเงินปอนด์อาจหยุดได้รับการสนับสนุน

ตามที่ได้กล่าวถึงมาก่อนหน้านี้หลายครั้ง ความแข็งแกร่งของสกุลเงินหลักที่ทำการซื้อขายกับดอลลาร์สหรัฐในตลาดแลกเปลี่ยนเงินตราต่างประเทศ (Forex) นั้นมีพื้นฐานจากความอ่อนแอโดยพื้นฐานของสกุลเงินอเมริกัน เนื่องจากความไม่แน่นอนที่แพร่หลายซึ่งเกิดจากกลไกการสงครามภาษีทั่วโลกของทรัมป์ การลดปัจจัยนี้อาจจะส่งผลบวกที่เห็นชัดเจนต่ออุปสงค์สำหรับดอลลาร์ ทำให้ได้รับการสนับสนุนในวงกว้าง ในเวลาเดียวกัน ธนาคารแห่งประเทศอังกฤษยังคงสงวนสิทธิ์ในการลดอัตราดอกเบี้ยต่อไป จากมุมมองทางเทคนิค คู่เงินนี้ยังคงอยู่ในแนวโน้มขาขึ้นในระยะกลาง แต่การแข็งค่าท้องถิ่นของดอลลาร์อาจนำไปสู่การลดลงสู่ขอบล่างของแนวโน้มนี้ ตามมาด้วยการลดลงที่ลึกกว่าเดิม ราคาปัจจุบันอยู่ต่ำกว่าจุดกึ่งกลางของ Bollinger

Pati Gani 11:27 2025-07-03 UTC+2

การคาดการณ์ตลาดฟอเร็กซ์ 03/07/2025: EUR/USD, USD/JPY, GBP/USD, SP500, ทองคำ และ Bitcoin

ลิงก์ที่มีประโยชน์: บทความอื่นๆ ของฉันสามารถเข้าดูได้ในส่วนนี้ คอร์ส InstaForex สำหรับผู้เริ่มต้น การวิเคราะห์ที่ได้รับความนิยม เปิดบัญชีซื้อขาย คำเตือน: ผู้เริ่มต้นในการซื้อขายฟอเร็กซ์ควรระมัดระวังเป็นพิเศษในการตัดสินใจเข้าสู่ตลาด ก่อนที่จะมีการเผยแพร่รายงานสำคัญ ควรอยู่ห่างจากตลาดเพื่อหลีกเลี่ยงการถูกจับในความผันผวนของตลาดอย่างฉับพลันเนื่องจากความผันผวนที่เพิ่มขึ้น หากคุณตัดสินใจที่จะทำการซื้อขายระหว่างการเผยแพร่ข่าว ควรตั้งคำสั่งหยุดทุกครั้งเพื่อลดการขาดทุนให้น้อยที่สุด หากไม่มีการตั้งคำสั่งหยุด

Sebastian Seliga 10:57 2025-07-03 UTC+2

การคาดการณ์สำหรับ GBP/USD ในวันที่ 3 กรกฎาคม 2025

ในกราฟรายชั่วโมง คู่เงิน GBP/USD ในวันพุธได้ฟื้นตัวจากระดับการปรับฐาน 200.0% ที่ 1.3749 และกลับตัวเป็นฝั่งดอลลาร์สหรัฐฯ ส่งผลให้ตกลงต่ำกว่าบริเวณแนวรับ 1.3611–1.3633 การตกลงนี้ดูเหมือนจะไม่มีเหตุผลที่ถูกต้อง และจนถึงเช้าวันพฤหัสบดี ราคาของปอนด์จัดวางอยู่เหนือโซน 1.3611–1.3633 ดังนั้น

Samir Klishi 10:03 2025-07-03 UTC+2

หากราคาน้ำมันดิบสามารถลดต่ำกว่าระดับ Pivot ได้ มีโอกาสที่จะทดสอบระดับ Support ที่ใกล้ที่สุดในวันพฤหัสบดีที่ 3 กรกฎาคม 2025

น้ำมันดิบ, วันพฤหัสบดีที่ 3 กรกฎาคม 2025 สภาพทางเศรษฐกิจทั่วโลกที่ย่ำแย่ เช่น ภาวะชะงักงันของการผลิตในจีนและยุโรป ได้ก่อให้เกิดความกังวลเกี่ยวกับความต้องการน้ำมันดิบทั่วโลกและการคาดการณ์ถึงการเพิ่มขึ้นศักยภาพในการผลิตน้ำมันทั่วโลกของ OPEC ซึ่งมีนโยบายการขยายการผลิตนี้ส่งผลให้เกิดภาวะอุปทานน้ำมันล้นตลาดชั่วคราว ระดับที่สำคัญ 1. แนวต้านที่สอง: 69.12

Arief Makmur 07:36 2025-07-03 UTC+2

ดัชนี Nasdaq 100 มีศักยภาพที่จะทดสอบระดับแนวต้านที่ใกล้ที่สุดในวันพฤหัสบดีที่ 3 กรกฎาคม 2025

ดัชนี Nasdaq 100, วันพฤหัสบดีที่ 3 กรกฎาคม 2025 รายงานการเงินของบริษัท Big Tech ที่เป็นบวกและข่าวลือที่ว่าธนาคารกลางสหรัฐอาจมีนโยบายเสรีขึ้น รวมถึงการเติบโตของนวัตกรรม AI ได้สร้างความเชื่อมั่นที่ดีต่อดัชนี Nasdaq

Arief Makmur 07:36 2025-07-03 UTC+2

การคาดการณ์สำหรับ EUR/AUD ในวันที่ 3 กรกฎาคม 2025

ในกราฟรายวัน คู่สกุลเงิน EUR/AUD กำลังเคลื่อนไหวไปด้านข้างในครึ่งบนของช่องราคาพร้อมกับอยู่เหนือเส้น MACD. เส้นสัญญาณของออสซิลเลเตอร์ Marlin กำลังลดลงเล็กน้อยภายในเขตบวก สร้างความตึงเครียดภายในที่มีศักยภาพสำหรับการดีดตัวขึ้นได้ การแทรกตัวออกจากช่องราคาสามารถเกิดขึ้นได้ที่ประมาณระดับ 1.8086 อย่างไรก็ตาม ระดับ 1.8144 ซึ่งเป็นจุดสูงสุดจากวันที่

Laurie Bailey 06:33 2025-07-03 UTC+2
หากไม่สะดวกคุยในตอนนี้
ระบุคำถามไว้ได้ใน แชท.
Widget callback
 

Dear visitor,

Your IP address shows that you are currently located in the USA. If you are a resident of the United States, you are prohibited from using the services of InstaFintech Group including online trading, online transfers, deposit/withdrawal of funds, etc.

If you think you are seeing this message by mistake and your location is not the US, kindly proceed to the website. Otherwise, you must leave the website in order to comply with government restrictions.

Why does your IP address show your location as the USA?

  • - you are using a VPN provided by a hosting company based in the United States;
  • - your IP does not have proper WHOIS records;
  • - an error occurred in the WHOIS geolocation database.

Please confirm whether you are a US resident or not by clicking the relevant button below. If you choose the wrong option, being a US resident, you will not be able to open an account with InstaForex anyway.

We are sorry for any inconvenience caused by this message.