Analysis of GBP/USD 5M
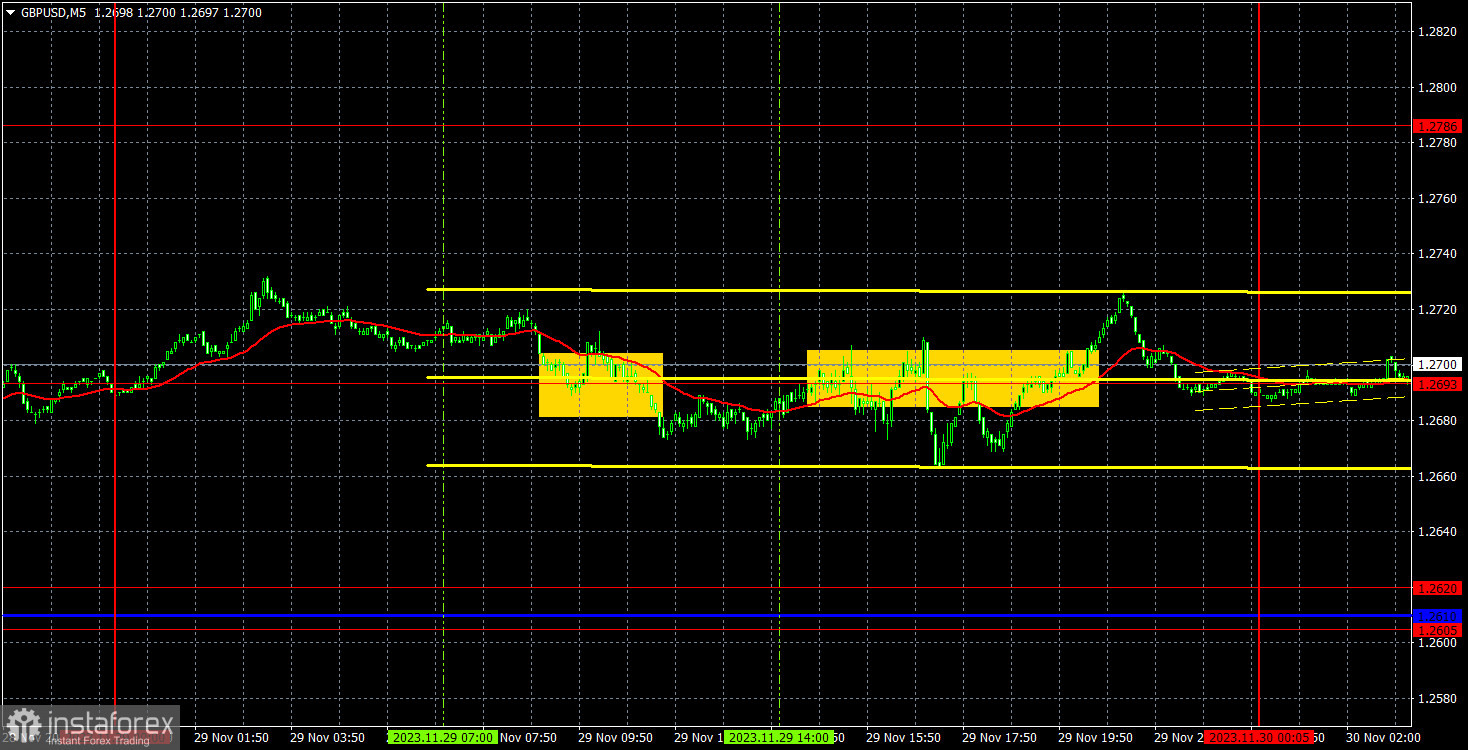
GBP/USD also experienced minor correction on Wednesday. The decline of the British pound was so weak that all the movement within the day looks simply like a flat. It is worth noting that this week there are no significant reports planned in the UK, and in the US, the first one was published yesterday. The GDP in the third quarter grew not by 4.9% or 5.0%, as forecasted, but by 5.2%. This means that the indicator turned out better than forecasts and should have triggered the dollar's growth. Since GDP is considered one of the most important indicators of the state of the economy, we should have seen a fairly strong rise in the US currency. But in reality, we saw almost nothing. The pair simply stood still for almost the entire day...
Unfortunately, in flat conditions the price came across the level of 1.2693. And, naturally, ignored it all day, forming trading signals in packs. All of the trading signals turned out to be false, and volatility was 70 pips. Thus, traders could try to execute the first one or two signals, but at the beginning of the US session, it became clear that the market was not going to respond to the GDP report, nor was it going to trade the pair. Therefore, all other signals should have been ignored. As a result, there was a minor loss at the end of the day.
COT report:
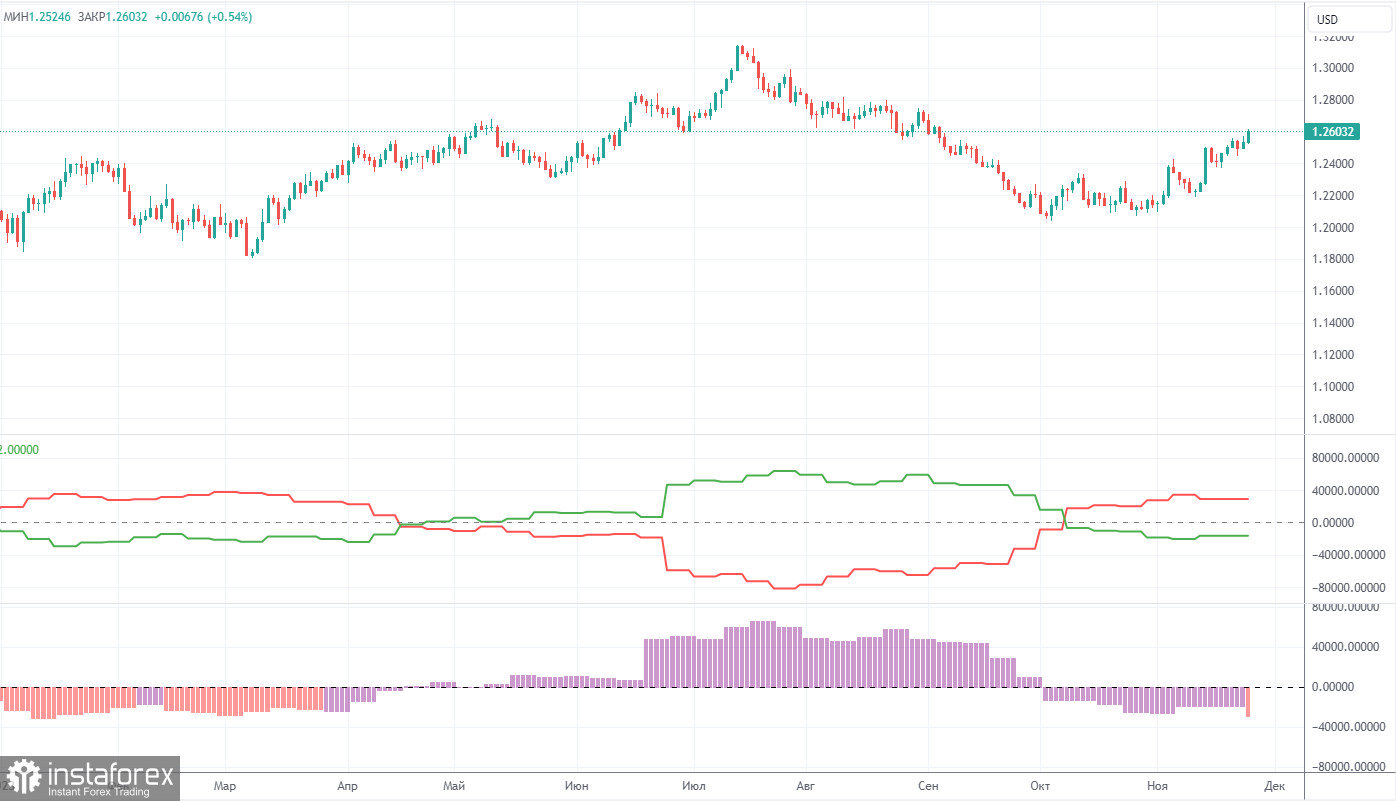
COT reports on the British pound also align perfectly with what's happening in the market. According to the latest report on GBP/USD, the non-commercial group closed 4,700 long positions and 6,700 short ones. Thus, the net position of non-commercial traders decreased by another 11,400 contracts in a week. The net position indicator has been steadily rising over the past 12 months, but it has been firmly decreasing since August. The British pound is also losing ground. We have been waiting for many months for the sterling to reverse downwards. Perhaps GBP/USD is at the very beginning of a prolonged downtrend or in the middle of a strong correction. At least in the coming months, we do not see significant prospects for the pound to rise. Even if the entire decline is just a correction, it could still last quite a long time.
The British pound has surged by a total of 2,800 pips from its absolute lows reached last year, which is an enormous increase. Without a strong downward correction, a further upward trend would be entirely illogical (if it is even planned). We don't rule out an extension of an uptrend. We simply believe that a substantial correction is needed first, and then we should assess the factors supporting the US dollar and the British pound. A correction to the level of 1.1844 would be enough to establish a fair balance between the two currencies. The non-commercial group currently holds a total of 52,300 longs and 80,50 shorts. The bears have been holding the upper hand in recent months, and we believe this trend will continue in the near future.
Analysis of GBP/USD 1H
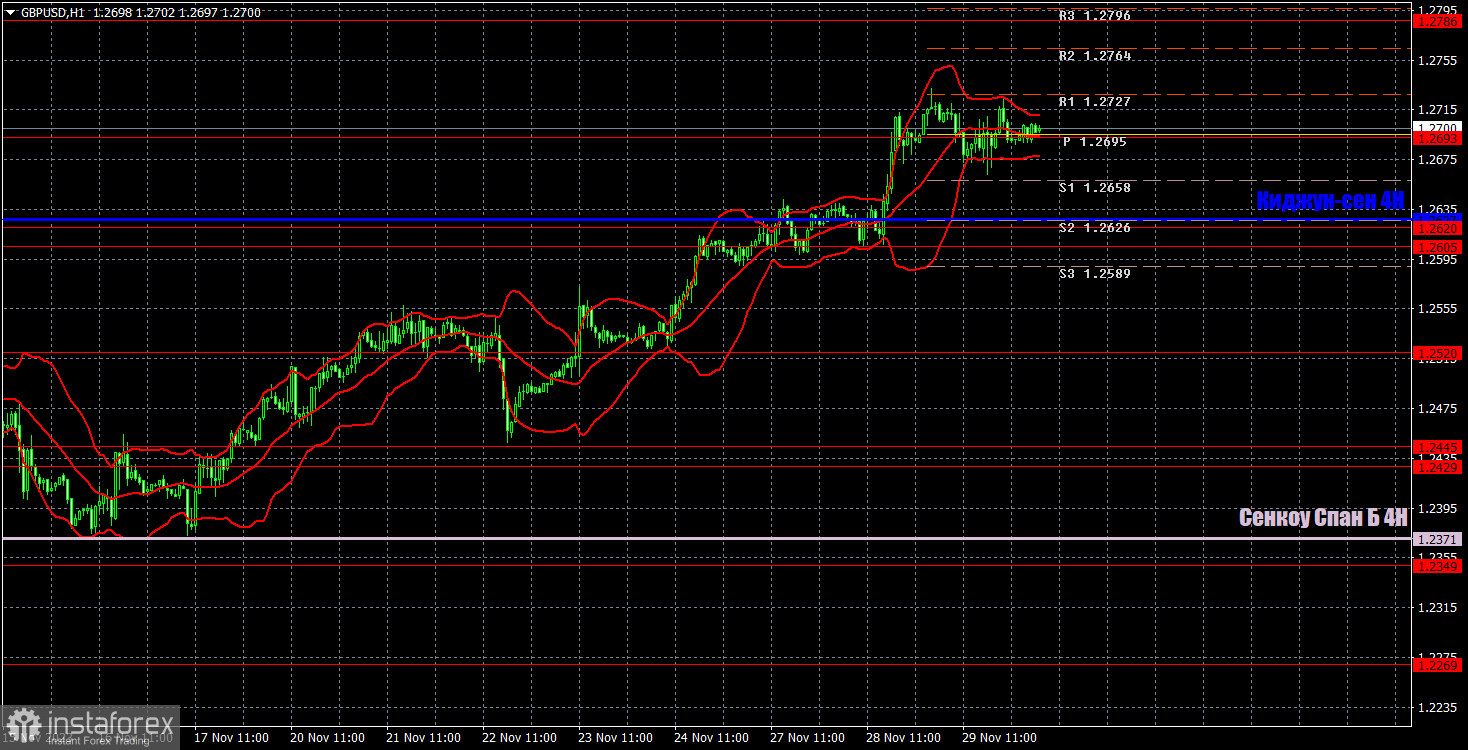
On the 1H chart, GBP/USD continues its short-term uptrend. For the past two or three weeks, we have been expecting a stable downward movement, but the market simply ignores all positive news for the dollar, buying the pound for no particular reason. Therefore, we believe that the pair is currently following the momentum, where fundamentals and macroeconomics are irrelevant. It doesn't make sense to consider consolidations below the critical line as a possible start of a downtrend.
As of November 30, we highlight the following important levels: 1.1927-1.1965, 1.2052, 1.2109, 1.2215, 1.2269, 1.2349, 1.2429-1.2445, 1.2520, 1.2605-1.2620, 1.2693, 1.2786, 1.2863. The Senkou Span B (1.2371) and Kijun-sen (1.2627) lines can also be sources of signals. Signals can be "bounces" and "breakouts" of these levels and lines. It is recommended to set the Stop Loss level to break-even when the price moves in the right direction by 20 pips. The Ichimoku indicator lines can move during the day, which should be taken into account when determining trading signals. The illustration also includes support and resistance levels that can be used to lock in profits from trades.
On Thursday, there are no significant events planned in the UK. From the US, there will be several less significant reports. If yesterday's reports on German inflation and US GDP were ignored, today's reports are even more likely to be ignored. We would say that European inflation has a greater chance of a market reaction than US reports.
Description of the chart:
Support and resistance levels are thick red lines near which the trend may end. They do not provide trading signals;
The Kijun-sen and Senkou Span B lines are the lines of the Ichimoku indicator, plotted to the 1H timeframe from the 4H one. They provide trading signals;
Extreme levels are thin red lines from which the price bounced earlier. They provide trading signals;
Yellow lines are trend lines, trend channels, and any other technical patterns;
Indicator 1 on the COT charts is the net position size for each category of traders;
Indicator 2 on the COT charts is the net position size for the Non-commercial group.