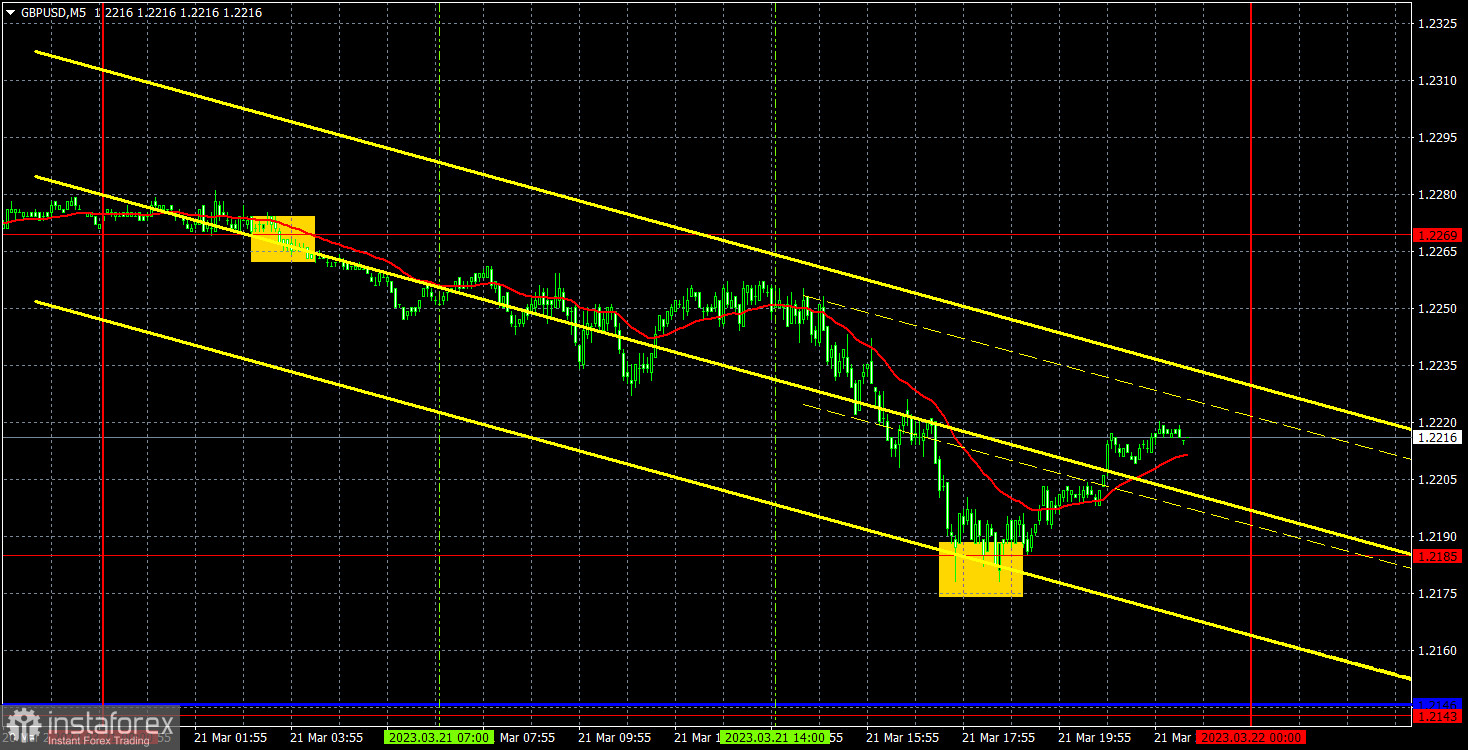
empty
22.03.2023 04:41 AM
GBP/USD: Forecast and trading signals on March 22. COT report. Detailed analysis of price movement and trades. The pound plummeted before the central bank meetings.

5M chart of GBP/USD

This image is no longer relevant

On Tuesday, GBP/USD surprisingly showed a completely different direction of movement than the EUR/USD pair. And as usual there were no reasons for that, because there were no important fundamental and macroeconomic events either in the US or in Great Britain. However, the "hit-parade" of the events for the GBP/USD pair will start today. The UK inflation report will be released in the morning, the Federal Reserve Board meeting in the evening and the Bank of England meeting tomorrow. There is no doubt that the market will react to these events, but many people are particularly expecting "surprises" from both banks. Therefore, it is impossible to predict where the pair will be on Thursday evening or Friday morning. The British currency is still in the "swing" mode, which means that the movement can be almost anything. Thus, yesterday's drop should come as no surprise to anyone.

There were two trade signals, which were formed on Tuesday. The first sell signal was formed during the night. However, at the European trading session, the price moved away from the point of formation only by 5-7 points, so a short position could be opened. Later, the price went down to 1.2185, from which it bounced back. Consequently, at this point, traders could close the short positions with profit of not less than 55 pips. Formally, traders could also work out the buy signal, but it formed too late, so they could skip it.

COT report:

This image is no longer relevant

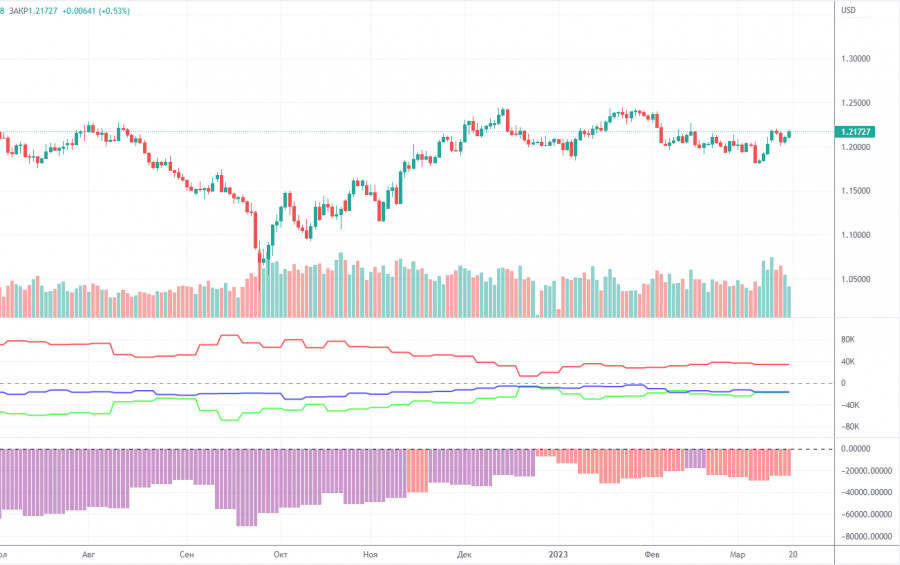
For the British pound, the COT reports are still coming out very late, with the CFTC continuing to catch up on the chart. The last report available is for March 7. According to that report, the non-commercial group opened 7,500 long positions and 1,200 short ones. Thus, the net position of non-commercial traders increased by 6,300 and continues to grow. The net position indicator has been steadily growing over the past months but the mood of major traders still remains bearish. Although the pound sterling is growing against the dollar (in the medium term), it is very difficult to answer the question why it is doing this from a fundamental point of view. It is quite possible that the pound sterling may slump in the near future. Formally, it has already begun its downward movement but so far it looks more like a flat. Notably, both major pairs are moving similarly at the moment. However, the net position for the euro is positive and even implies the imminent completion of the upward momentum, whereas for the pound it is negative. But at the same time, the pound has already grown by 2100 points, which is a lot, and without a strong bearish correction the continuation of the growth will be absolutely illogical. The non-commercial group opened a total of 66,000 shorts and 46,000 longs. We remain skeptical about the long-term growth in the British currency and expect it to fall deeper.
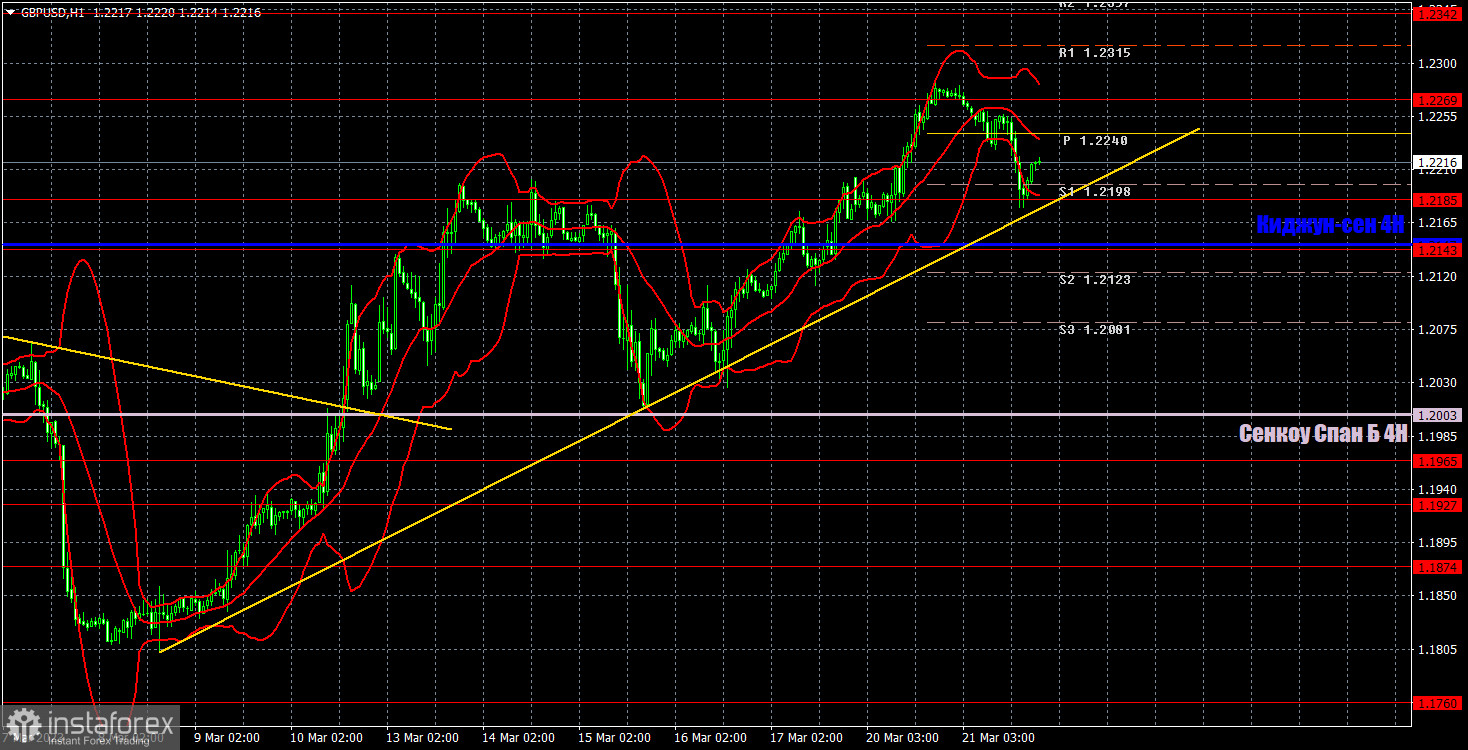
1H chart of GBP/USD

This image is no longer relevant

On the one-hour chart, GBP/USD continues to trade higher, supported by the trend line. However, it continues to move within the horizontal channel on the 24-hour chart, which, I should remind you, is 600 pips wide. Therefore, the pound has the potential to rise, but only technically. From a fundamental point of view, I expect the pound to fall for a long time, but at the moment, there is a trend line, which supports the growth. Therefore, until the pair settles below the trend line, the uptrend could persist. On March 22, it is recommended to trade at the key level of 1.1927, 1.1965, 1.2143, 1.2185, 1.2269, 1.2342, 1.2429-1.2458, 1.2589. The Senkou Span B (1.2003) and Kijun Sen (1.2146) lines can also generate signals. Rebounds and breakouts from these lines can also serve as trading signals. It is better to set the Stop Loss at breakeven as soon as the price moves by 20 pips in the right direction. The lines of the Ichimoku indicator can change their position throughout the day which is worth keeping in mind when looking for trading signals. On Wednesday, there will be at least two important events for the pair: the UK inflation report and the announcement of the results of the Federal Reserve meeting with a speech by Jerome Powell. Both of these events may provoke serious market reaction.

Indicators on charts:

Resistance/support - thick red lines, near which the trend may stop. They do not make trading signals.

Kijun-sen and Senkou Span B are the Ichimoku indicator lines moved to the hourly timeframe from the 4-hour timeframe. They are also strong lines.

Extreme levels are thin red lines, from which the price used to bounce earlier. They can produce trading signals.

Yellow lines are trend lines, trend channels, and any other technical patterns.

Indicator 1 on the COT chart is the size of the net position of each trader category.

Indicator 2 on the COT chart is the size of the net position for the Non-commercial group of traders.

Paolo Greco,
Especialista em análise na InstaForex
© 2007-2025
Selecionar intervalo de tempo
5
min
15
min
30
min
1
hora
4
horas
1
dia
1
s.
Ganhe com as variações das taxas das criptomoedas com a InstaForex.
Baixe o MetaTrader 4 e abra a sua primeira operação.
  • Grand Choice
    Contest by
    InstaForex
    InstaForex always strives to help you
    fulfill your biggest dreams.
    PARTICIPE DO CONCURSO

Recommended Stories

Como negociar o par EUR/USD em 19 de maio? Dicas simples e análise de negociação para iniciantes

Análise das negociações de sexta-feira Gráfico 1H do EUR/USD Na sexta-feira, o par EUR/USD registrou uma queda significativa, apesar da ausência de fatores macroeconômicos ou fundamentais claros. Ainda assim

Paolo Greco 17:02 2025-05-19 UTC+2

Ideia de negociação para a queda do EUR/USD

Após o forte momentum de baixa de sexta-feira, o instrumento entrou em uma correção de alta e, no momento, está testando a zona de ruptura curta, a partir da qual

Andrey Shevchenko 17:32 2025-05-05 UTC+2

Ideia de negociação para a queda do GBP/USD

Após o forte movimento de baixa de curto prazo observado na sexta-feira, o par entrou em uma correção de alta e, neste momento, está testando uma zona de ruptura

Andrey Shevchenko 16:01 2025-05-05 UTC+2

EUR/USD: Plano de Negociação para a Sessão dos E.U.A. de 30 de abril (Revisão das Negociações da Manhã)

Na minha previsão matinal, destaquei o nível 1,1378 e planejei basear as decisões de entrada no mercado nele. Vamos dar uma olhada no gráfico de 5 minutos e analisar

Miroslaw Bawulski 14:52 2025-04-30 UTC+2

EUR/USD: Plano de Negociação para a Sessão dos E.U. de 24 de abril (Revisão das Negociações da Manhã)

Na minha previsão matinal, concentrei-me no nível 1,1358 e planejei tomar decisões de negociação com base nele. Vamos dar uma olhada no gráfico de 5 minutos para entender

Miroslaw Bawulski 21:48 2025-04-24 UTC+2

Como negociar o par EUR/USD em 22 de abril? Dicas simples e análise de negociação para iniciantes

Análise das operações de segunda-feira Gráfico 1H do EUR/USD O par EUR/USD iniciou a segunda-feira com uma forte recuperação. Durante a madrugada, o euro avançou entre 100 e 120 pips

Paolo Greco 15:10 2025-04-22 UTC+2

Como negociar o par GBP/USD em 11 de abril? Dicas simples e análise de negociação para iniciantes

Análise das operações de quinta-feira Gráfico 1H do GBP/USD Nas últimas 24 horas, o par GBP/USD avançou 170 pips, e a valorização da libra esterlina continuou durante a madrugada desta

Paolo Greco 16:46 2025-04-11 UTC+2

Como negociar o par GBP/USD em 7 de abril? Dicas simples e análise de negociação para iniciantes

Análise das operações de sexta-feira Gráfico 1H do GBP/USD O par GBP/USD registrou uma forte correção na sexta-feira, um movimento difícil de justificar — mesmo com a vantagem da retrospectiva

Paolo Greco 16:28 2025-04-07 UTC+2

Como negociar o par EUR/USD em 7 de abril? Dicas simples e análise de negociação para iniciantes

Análise das operações de sexta-feira Gráfico 1H de EUR/USD O par EUR/USD permaneceu sob forte instabilidade nesta sexta-feira. Desta vez, o movimento de baixa predominou — mas isso não tornou

Paolo Greco 15:51 2025-04-07 UTC+2

EUR/USD: Plano de Negociação para a Sessão dos E.U.A de 4 de Abril (Revisão das Negociações da Manhã)

Na minha previsão matinal, destaquei o nível 1,0994 e planejei basear minhas decisões de entrada no mercado nele. Vamos dar uma olhada no gráfico de 5 minutos e analisar

Miroslaw Bawulski 19:56 2025-04-04 UTC+2
Não pode falar agora?
Faça sua pergunta no chat.
Widget callback
 

Dear visitor,

Your IP address shows that you are currently located in the USA. If you are a resident of the United States, you are prohibited from using the services of InstaFintech Group including online trading, online transfers, deposit/withdrawal of funds, etc.

If you think you are seeing this message by mistake and your location is not the US, kindly proceed to the website. Otherwise, you must leave the website in order to comply with government restrictions.

Why does your IP address show your location as the USA?

  • - you are using a VPN provided by a hosting company based in the United States;
  • - your IP does not have proper WHOIS records;
  • - an error occurred in the WHOIS geolocation database.

Please confirm whether you are a US resident or not by clicking the relevant button below. If you choose the wrong option, being a US resident, you will not be able to open an account with InstaForex anyway.

We are sorry for any inconvenience caused by this message.