Bitcoin continues its decline, showing no signs of correction. The daily chart clearly indicates that none of the last three FVGs have been worked off. On the 4-hour timeframe, it is evident that none of the last three FVGs have been addressed. What does this signify? It indicates that Bitcoin is not correcting at all. At best, it isn't falling; it's merely stagnant. However, such scenarios are rare. Yesterday, the world's first cryptocurrency dipped below the $74,000 mark, and this is still far from the limit of its decline. We continue to assert that a downward trend is forming, which will last for at least one year. If there is currently a downward trend and no signs of even a slight upward correction, what should be expected from Bitcoin?
As a target, we continue to consider $70,800, which is not too far off. Over the past six months, Bitcoin has depreciated by 40%, and this is still quite modest. For instance, Ethereum (the second-largest cryptocurrency) lost 56% of its value. It is also worth recalling that every Bitcoin price uptrend has ended with a decline of 70-80%. Therefore, there is significant space for downward movement. For traders, it doesn't particularly matter what the current trend is; the main thing is to identify it correctly. Investors should be cautious, and they are currently exiting the cryptocurrency market in favor of more stable precious metals and stocks.
Meanwhile, "crypto-experts" are frantically seeking ways to attract investors to the plummeting price of Bitcoin. Robert Kiyosaki has once again stated that he is only buying Bitcoin, while Cathie Wood has recommended selling gold and silver to buy more Bitcoin. These globally recognized investors may be right, but it's essential to remember that they are investors, not traders. In the next 6-8 months, Bitcoin could very well drop significantly further.
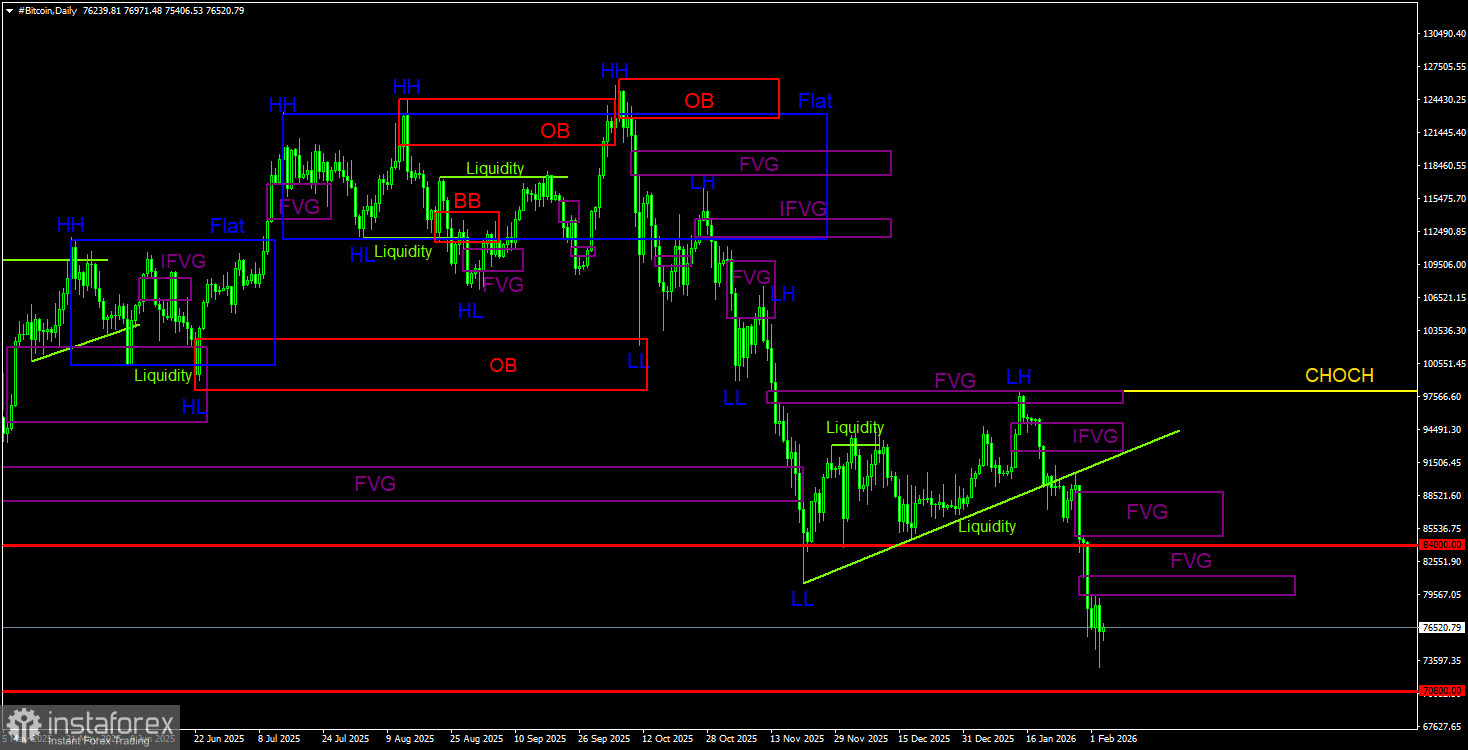
Overall Picture of BTC/USD on the 1D Chart
On the daily timeframe, Bitcoin continues to form a downward trend. The trend structure is bearish, with the CHOCH line currently at $97,900. Only above this level can it be considered that the downward trend has ended. By 2026, Bitcoin could fall to as low as $60,000, from where it began its last ascent. Only one month into the new year, Bitcoin has already dropped to $74,000. The price has reacted clearly to the "bearish" FVG ($96,900-$98,000), triggering a trading signal. Since then, Bitcoin has lost about $20,000. The target of the current downward movement is the $70,800 – 50.0% level, according to Fibonacci. Among the new areas of POI for selling, we highlight the "bearish" IFVG and two "bearish" FVGs. In the future, trades can be opened based on these patterns.
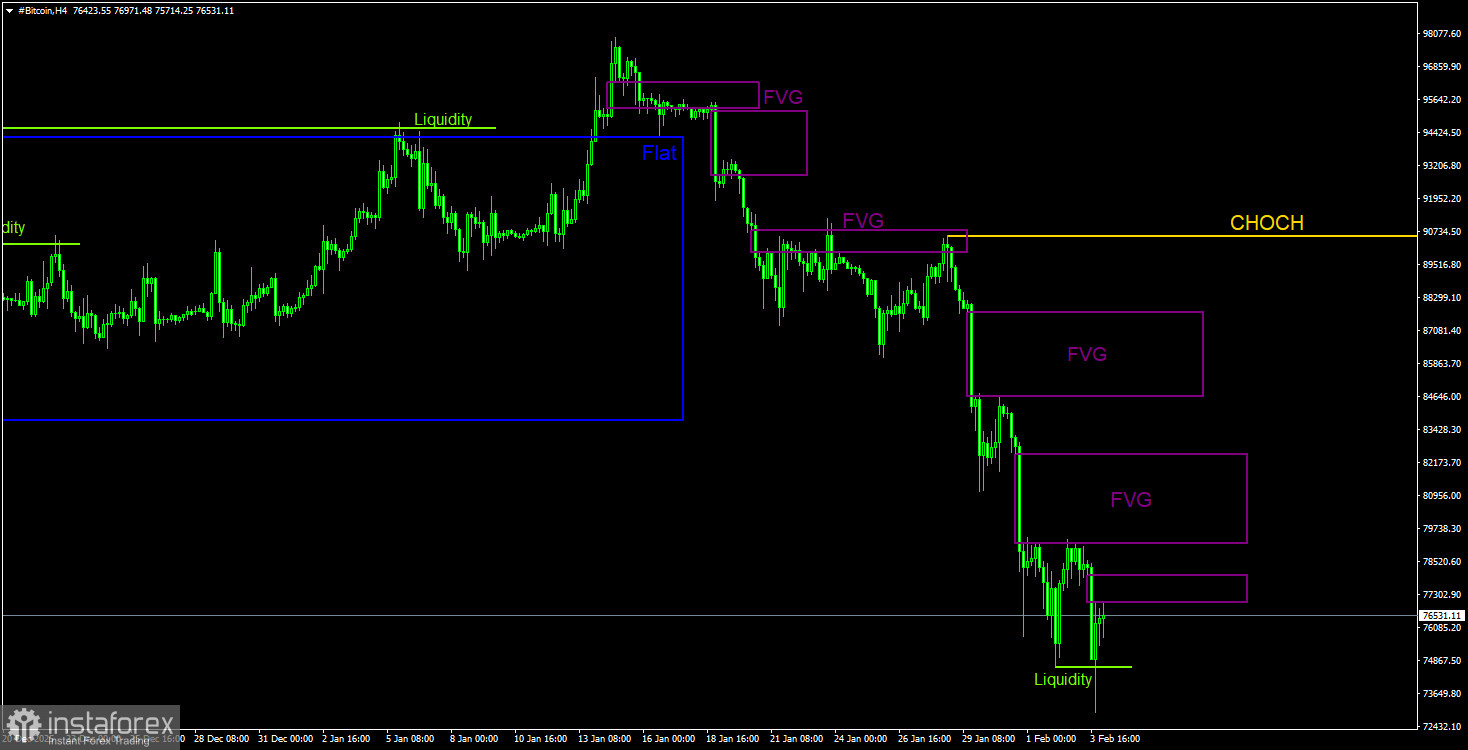
Overall Picture of BTC/USD on the 4H Chart
On the 4-hour timeframe, the price continues to form a new bearish structure. The CHOCH line now stands at $90,560; only above that level can the trend be said to be transforming into an upward one. However, at present, there are no signs that Bitcoin will end its decline shortly. On the contrary, the price is falling at lightning speed and is showing no signs of minimal corrections. During the last leg of the decline, three "bearish" FVGs were formed. Currently, Bitcoin has failed to correct to any of them. The liquidity removal on the buy side warns of a possible pullback, but that is the only sign of potential growth.
Trading Recommendations for BTC/USD:
Bitcoin continues to form a full downward trend. We continue to expect a decline to $70,800 (50.0% Fibonacci level from a three-year upward trend), and there are no signs of a trend reversal or correction. From the POI areas for selling on the daily timeframe, we can highlight the "bearish" IFVG and two bearish FVGs. On the 4-hour timeframe, three bearish FVGs can create opportunities to open new shorts. The closest patterns are of the most considerable interest.
Explanations for Illustrations:
- CHOCH – Change of Character in trend structure.
- Liquidity – Stop Loss liquidity for traders that market-makers use to build their positions.
- FVG – Fair Value Gap. Prices pass through such areas very quickly, indicating a complete lack of one of the sides in the market. Subsequently, prices tend to return and react to such areas.
- IFVG – Inverted Fair Value Gap. After returning to such an area, the price does not react and instead breaks through impulsively and then tests it from the opposite side.
- OB – Order Block. The candle where the market-maker opened a position to collect liquidity for forming its own position in the opposite direction.