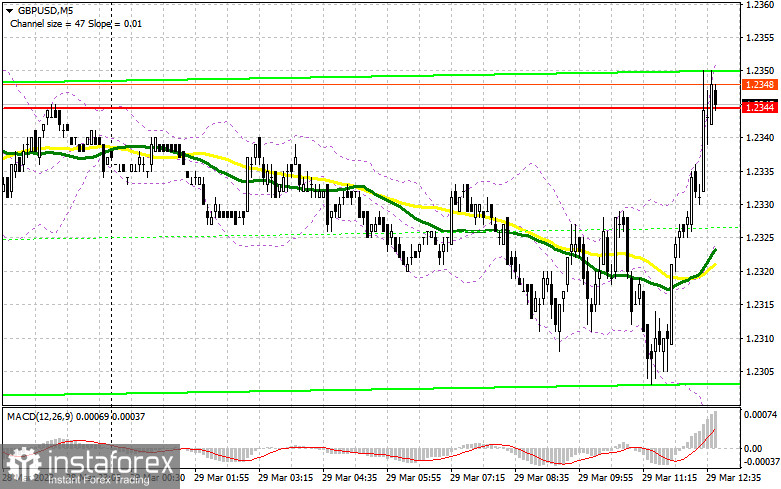
I focused on the level of 1.2296 when I made my morning forecast and suggested trading choices based on it. Let's take a look at the 5-minute chart to see what happened. It was possible to get an entry point after the decline in the area of 1.2296, but a few points were lacking before the test of this level and the buy signal. The technical situation was left unchanged for the remainder of the day.
You require the following to open long positions on the GBP/USD:
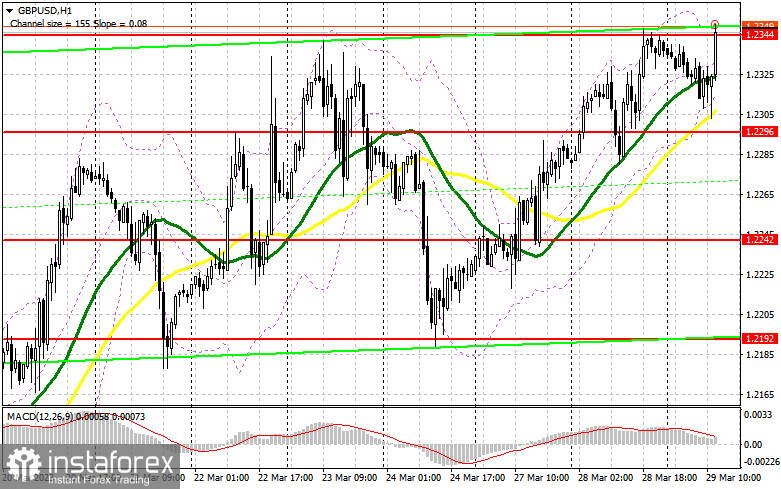
The pound's situation was strengthened by the Bank of England meeting minutes, and the bulls are now focused on breaking through and updating monthly highs. Naturally, I'd like to find a way to enter a decline of around 1.2296, so this possibility shouldn't be ignored either. A breakout and a test from the top down of this range will form an additional buy signal, which will return the bull market and push GBP/USD to 1.2395. If a false breakout forms at this level, and the moving averages playing on the side of the bulls also pass, the pair will return to 1.2344. It will be challenging for GBP/USD purchasers to predict the continuation of a new rally without this level. If we exit above this range, we can discuss growth to 1.2443, where I will fix profits, against the backdrop of very weak fundamental data on the US housing market. The area of 1.2505, which is unlikely to be updated today, will be the target that is the farthest away. The pound may revert to being under the control of sellers if GBP/USD declines and there are no buyers at 1.2296, which is also not ruled out. If this occurs, I advise delaying long options until 1.2242. I suggest only making purchases based on a false breakout. To correct 30-35 points within a day, it is possible to initiate long positions on the GBP/USD immediately for a rebound from 1.2192.
For opening short positions on the GBP/USD, you will need:
Sellers did everything possible the day before, but it did not work out to achieve a solid downward correction. You must now consider how to protect the monthly maximum because, if you fail to do so, you risk losing the chance to trade the pair in the side channel. Barr, a representative of the Federal Reserve System, made some hawkish statements that will help bears create a false collapse in the area of 1.2344, which will result in a sell signal and a continued decline to 1.2296. After yesterday's growth, a breakout and a reverse test from the bottom up of this range will provide an entry point for selling, already with an update of the 1.2242 minimum. The area around 1.2192, which serves as the bottom boundary of the side channel, will serve as a further target. The pound will come under pressure again if this level is updated, and a new bearish trend may develop as a result. The bull market will reappear with the possibility of GBP/USD growth and the absence of bears at 1.2344 in the afternoon, which is more probable. This will cause an abrupt decline of GBP/USD to the area of a new maximum of 1.2395. A false breakout at this level creates an entry point into short positions based on the decline of the pound. If there isn't any action there, I suggest selling GBP/USD at 1.2443 in the hopes that the pair will decline another 30-35 points during the day.
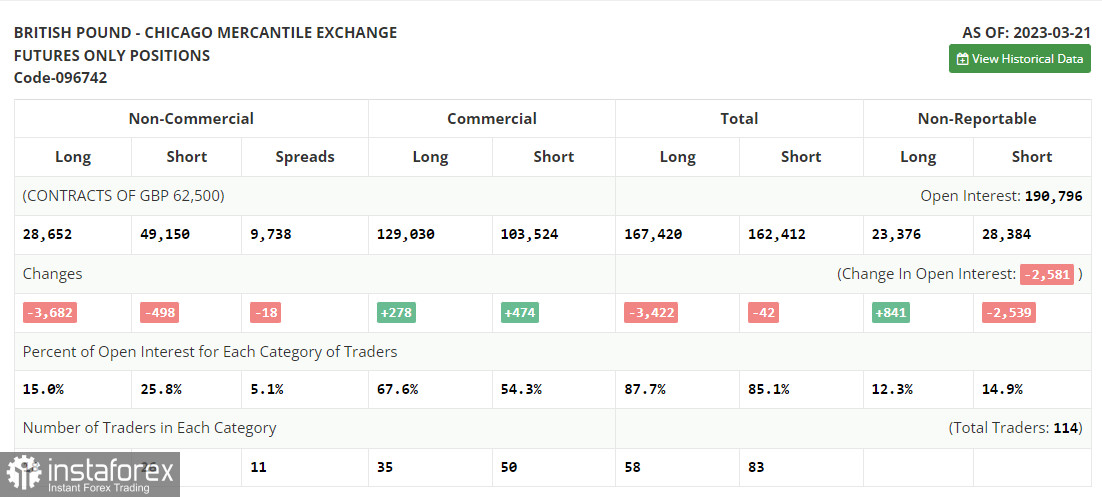
Both long and short positions decreased in the COT report (Commitment of Traders) for March 21. The Bank of England meeting in March went fairly smoothly. Given how poorly things are going with UK inflation, it was an entirely predictable decision to raise interest rates while maintaining the chance of future growth. Based on the most recent data, the price rise persisted in February, necessitating more aggressive action on the part of the regulator about borrowing costs. Given that many anticipate a relaxing of the Federal Reserve System's control, the British pound has a strong probability of growing further. According to the most recent COT data, short non-commercial positions fell by 498 to 49,150, while long non-commercial positions fell by 3,682 to 28,652, increasing the non-commercial net position's negative value to -20,498 from -17,314 a week earlier. In contrast to 1.2199, the weekly ending price increased to 1.2241.
Signals from indicators
Moving Averages
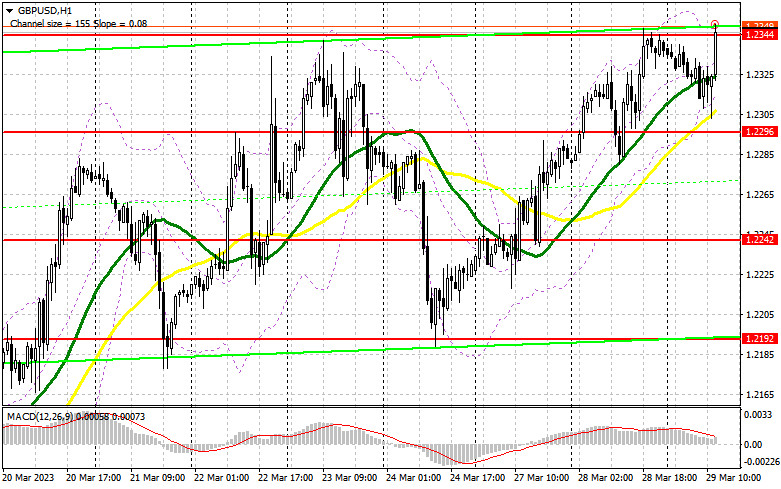
Trading is taking place above the 30- and 50-day moving averages, which suggests that the pound will continue to rise.
Notably, the author considers the time and prices of moving averages on the hourly chart H1 and departs from the standard definition of the traditional daily moving averages on the daily chart D1.
Bands by Bollinger
The indicator's lower limit, which is located around 1.2300, will provide support in the event of a decline.
Description of indicators
- Moving average (moving average determines the current trend by smoothing out volatility and noise). Period 50. The graph is marked in yellow.
- Moving average (moving average determines the current trend by smoothing out volatility and noise). Period 30. The graph is marked in green.
- MACD indicator (Moving Average Convergence / Divergence - moving average convergence/divergence) Fast EMA period 12. Slow EMA period 26. SMA period 9
- Bollinger Bands (Bollinger Bands). Period 20
- Non-profit speculative traders, such as individual traders, hedge funds, and large institutions, use the futures market for speculative purposes and to meet certain requirements.
- Long non-commercial positions represent the total long open position of non-commercial traders.
- Short non-commercial positions represent the total short open position of non-commercial traders.
- Total non-commercial net position is the difference between the short and long positions of non-commercial traders.