Analyzing trades on Tuesday:
EUR/USD on 30M chart
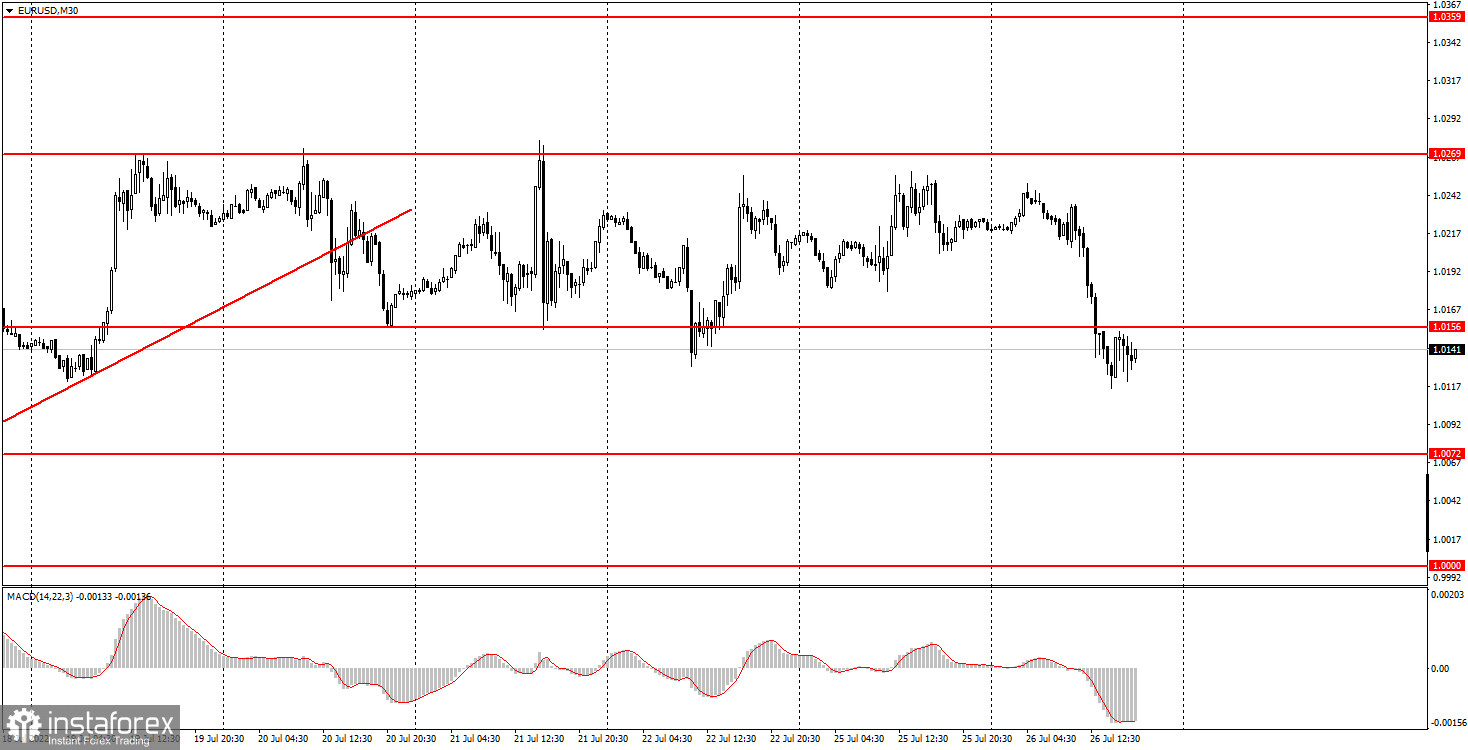
EUR/USD left the sideways channel on Tuesday and tumbled ahead of the announcement of the Fed's meeting results. In total, the pair dropped by 120 pips. Surprisingly, this fall happened amid an almost empty macroeconomic calendar. So, for no reason, the price plummeted by 120 pips and left the sideways channel where it had been stuck for more than a week. Of course, such a decline was happening ahead of the outcome of the Fed meeting. Markets expect the regulator to raise the rate by at least 0.75%. That is why the demand for the US dollar is rising. It seems that market participants started to buy USD beforehand. Actually, this often happens ahead of the policy meetings of central banks. Therefore, just as I assumed earlier, the pair failed to break above the level of 1.0269 and continue the uptrend. Now a new decline in the euro is very likely, with a retest of local lows or 20-year lows and a break below the parity level. The fundamental background is still negative for the euro which is why the European currency will continue to lose ground.
EUR/USD on 5M chart
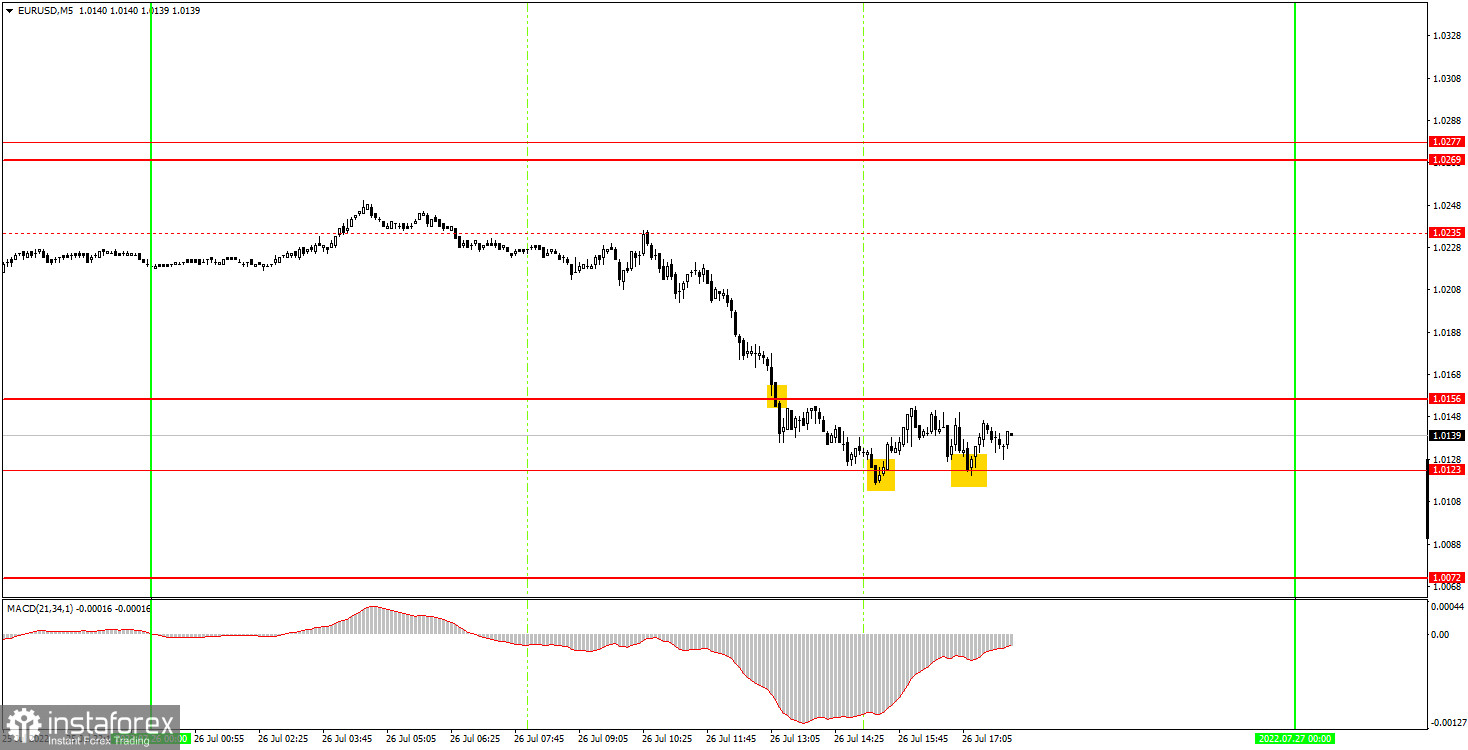
On the 5-minute chart, the movement was good during the day. Unfortunately, the only level of 1.0235 that could have been used to enter the market was ignored by me. This is what happens when the pair is trading in the sideways channel. One day it forms 5 false signals near this level and the next day it shows a very strong signal with great potential profit near the same level. Yet, instead of following the strong signal, we missed all downward movement. The first sell signal was formed when the price passed the level of 1.0156. Following this signal could have brought traders 10 pips the most because the next level of 1.0123 stopped the downward movement. A rebound from 1.0123 could also have been used as a signal. Yet, the price failed to move by even 20 pips in the right direction. Nevertheless, I managed to set a Stop Loss to breakeven. The next bounce from the 1.0123 level was even worse. At one point, the price was trying to consolidate below 1.0123. The fall of the European currency may well continue further, and it is up to you whether to follow this signal or not.
Trading tips on Wednesday
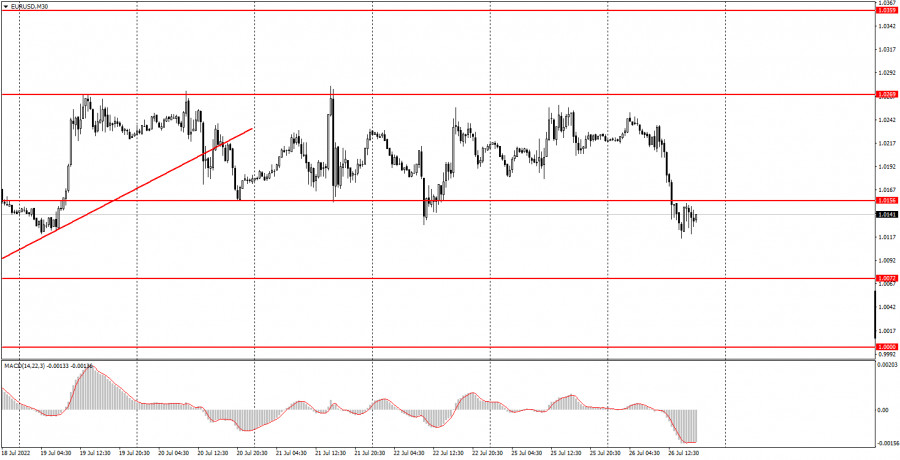
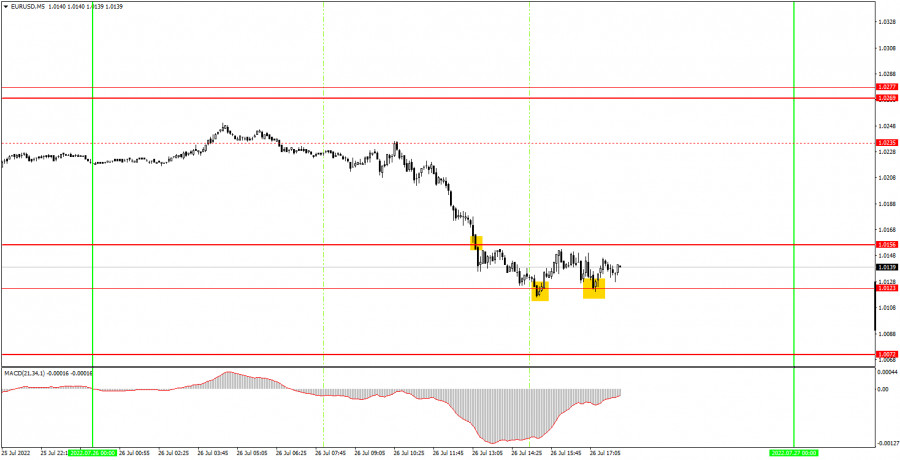
On the 30-minute time frame, the uptrend was canceled and there are all signs that the euro will be extending its decline. The reason for this is the rate hike of at least 0.75% by the Fed. On the 5M chart on Wednesday, it is recommended to trade from the levels of 0.9952, 1.0000, 1.0072, 1.0123, 1.0156, 1.0269-1.0277, and 1.0354. Set a Stop Loss to breakeven as soon as the price moves by 15 pips in the right direction. On Wednesday, no important reports are expected in the EU. Meanwhile, the US will publish the data on durable goods orders and later in the day, the outcome of the Fed meeting will be announced. The pair may be volatile and may trade within a trend throughout the whole day.
Basic rules of the trading system
1) The strength of the signal is determined by the time it took the signal to form (a rebound or a breakout of the level). The quicker it is formed, the stronger the signal is.
2) If two or more positions were opened near a certain level based on a false signal (which did not trigger a Take Profit or test the nearest target level), then all subsequent signals at this level should be ignored.
3) When trading flat, a pair can form multiple false signals or not form them at all. In any case, it is better to stop trading at the first sign of a flat movement.
4) Trades should be opened in the period between the start of the European session and the middle of the US trading hours, when all positions must be closed manually.
5) You can trade using signals from the MACD indicator on the 30-minute time frame only amid strong volatility and a clear trend that should be confirmed by a trendline or a trend channel.
6) If two levels are located too close to each other (from 5 to 15 pips), they should be considered support and resistance levels.
On the chart
Support and Resistance Levels are the levels that serve as targets when buying or selling the pair. You can place Take Profit near these levels.
Red lines are channels or trend lines that display the current trend and show in which direction it is better to trade now.
The MACD indicator (14, 22, and 3) consists of a histogram and a signal line. When they cross, this is a signal to enter the market. It is recommended to use this indicator in combination with trend patterns (channels and trendlines).
Important announcements and economic reports that can be found on the economic calendar can seriously influence the trajectory of a currency pair. Therefore, at the time of their release, we recommend trading as carefully as possible or exiting the market in order to avoid sharp price fluctuations.
Beginners on Forex should remember that not every single trade has to be profitable. The development of a clear strategy and money management is the key to success in trading over a long period of time.