empty
сформирован 05.06 в 10:19:16 (UTC+0)
сила сигнала 1 из 5
Медвежий симметричный треугольник #Bitcoin M5

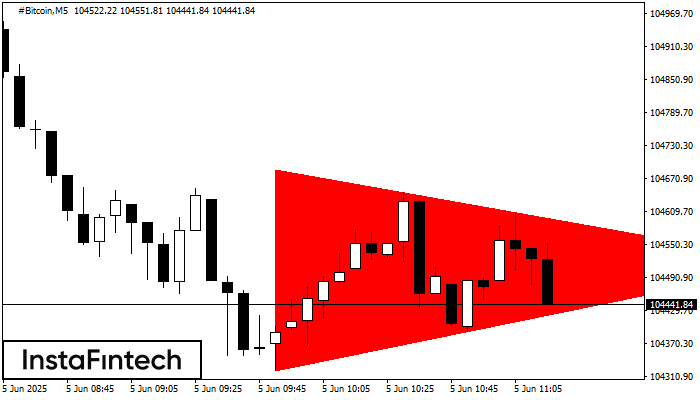
По #Bitcoin M5 сформировалась фигура «Медвежий симметричный треугольник». Данная фигура сигнализирует нам о продолжении нисходящего тренда в случае пробоя нижней границы 104321.45, где вероятная прибыль будет являться шириной текущей фигуры -36540 пунктов.

Таймфреймы М5 и М15 могут иметь больше ложных точек входа.

Фигура
  • Все
  • Вымпел
  • Голова и плечи
  • Двойная вершина
  • Прямоугольник
  • Треугольник
  • Тройная вершина
  • Флаг
Инструмент
  • Все
  • #AAPL
  • #AMZN
  • #Bitcoin
  • #EBAY
  • #FB
  • #GOOG
  • #INTC
  • #KO
  • #MA
  • #MCD
  • #MSFT
  • #NTDOY
  • #PEP
  • #TSLA
  • #TWTR
  • AUDCAD
  • AUDCHF
  • AUDJPY
  • AUDUSD
  • EURCAD
  • EURCHF
  • EURGBP
  • EURJPY
  • EURNZD
  • EURRUB
  • EURUSD
  • GBPAUD
  • GBPCHF
  • GBPJPY
  • GBPUSD
  • GOLD
  • NZDCAD
  • NZDCHF
  • NZDJPY
  • NZDUSD
  • SILVER
  • USDCAD
  • USDCHF
  • USDJPY
  • USDRUB
Таймфрейм
  • Все
  • M5
  • M15
  • M30
  • H1
  • D1
Тренд
  • Все
  • Покупка
  • Продажа
Сила сигнала
  • Все
  • 1
  • 2
  • 3
  • 4
  • 5
Bearish Symmetrical Triangle
was formed on 20.08 at 08:17:06 (UTC+0)
signal strength 1 of 5
Bearish Symmetrical Triangle NZDCHF M5

According to the chart of M5, NZDCHF formed the Bearish Symmetrical Triangle pattern. Description: The lower border is 0.4702/0.4708 and upper border is 0.4715/0.4708. The pattern width is measured

The M5 and M15 time frames may have more false entry points.

Open chart in a new window
Double Bottom
was formed on 20.08 at 08:00:24 (UTC+0)
signal strength 2 of 5
Double Bottom NZDUSD M15

The Double Bottom pattern has been formed on NZDUSD M15; the upper boundary is 0.5833; the lower boundary is 0.5817. The width of the pattern is 18 points. In case

The M5 and M15 time frames may have more false entry points.

Open chart in a new window
Bearish Symmetrical Triangle
was formed on 20.08 at 07:46:50 (UTC+0)
signal strength 1 of 5
Bearish Symmetrical Triangle GBPJPY M5

According to the chart of M5, GBPJPY formed the Bearish Symmetrical Triangle pattern. Description: The lower border is 198.67/198.78 and upper border is 198.91/198.78. The pattern width is measured

The M5 and M15 time frames may have more false entry points.

Open chart in a new window
Ҳозир телефон орқали гаплаша олмайсизми?
Саволингизни беринг чатда.
Обратный звонок
 

Dear visitor,

Your IP address shows that you are currently located in the USA. If you are a resident of the United States, you are prohibited from using the services of InstaFintech Group including online trading, online transfers, deposit/withdrawal of funds, etc.

If you think you are seeing this message by mistake and your location is not the US, kindly proceed to the website. Otherwise, you must leave the website in order to comply with government restrictions.

Why does your IP address show your location as the USA?

  • - you are using a VPN provided by a hosting company based in the United States;
  • - your IP does not have proper WHOIS records;
  • - an error occurred in the WHOIS geolocation database.

Please confirm whether you are a US resident or not by clicking the relevant button below. If you choose the wrong option, being a US resident, you will not be able to open an account with InstaForex anyway.

We are sorry for any inconvenience caused by this message.