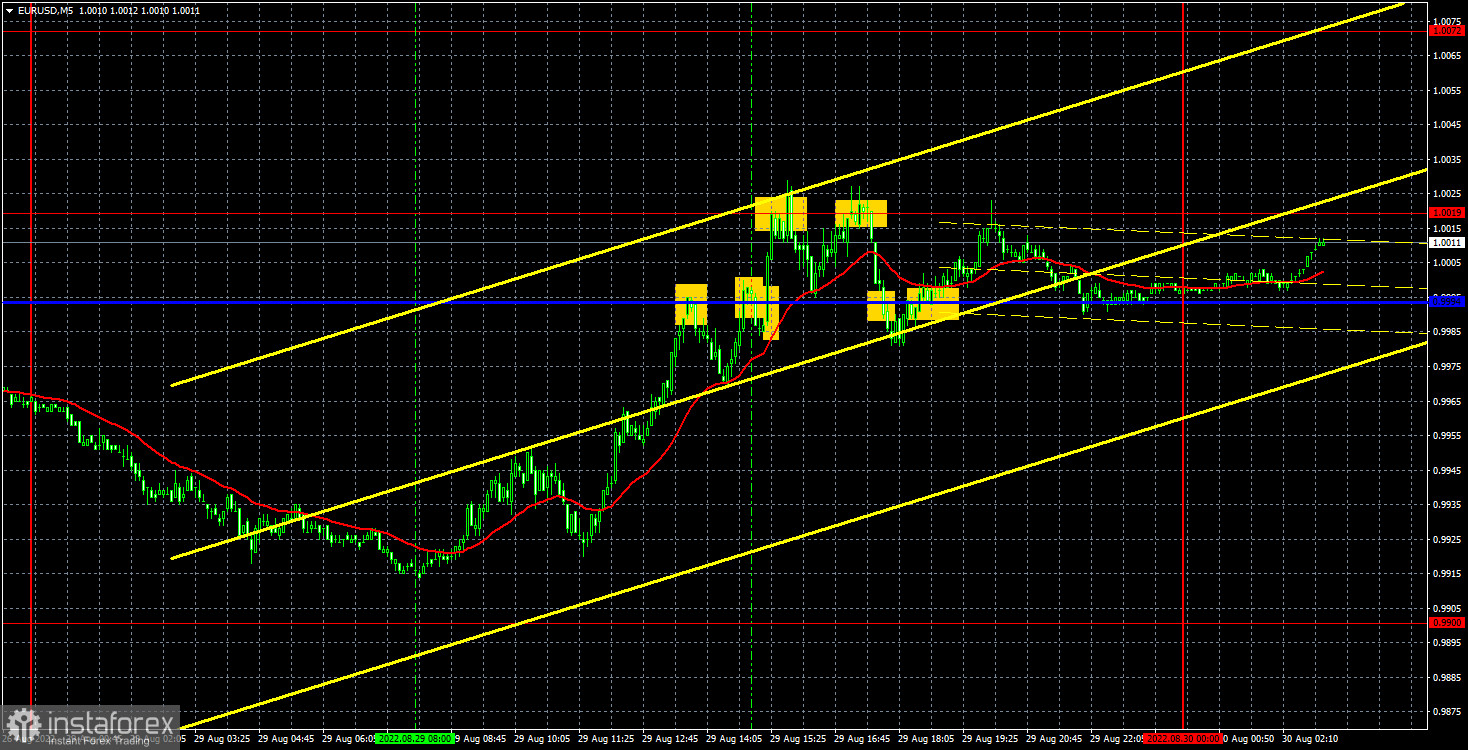
EUR/USD 5M
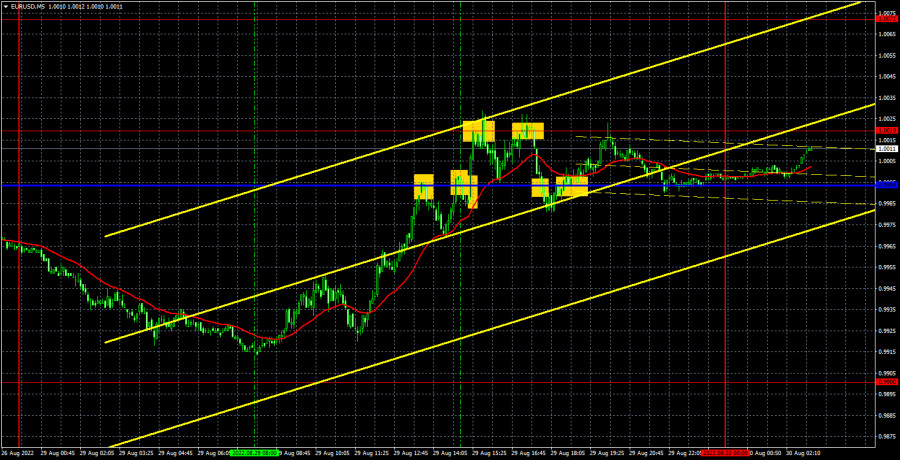
The EUR/USD pair tried to resume its downward movement on Monday, but still could not resist the temptation to trade inside the horizontal channel of 0.9900-1.0019 for some more time. And if the price did not manage to reach the lower border of this channel at night, then it worked out the upper one perfectly. Unfortunately, such movements inside the flat are far from always possible to work out. Recall that the ideal places for forming signals inside the horizontal channel are its boundaries. And yesterday there was no rebound from the lower border. Accordingly, almost all the upward movement during the day was missed. But we'll talk about this in a bit. So far, we should take note of the pair's high volatility during the day. It passed over 100 points. It should also be noted that the current movement looks even more like a "roller coaster" or "swing" rather than a flat, as the price moves in a limited range, but at the same time with high volatility. There were no important statistics or fundamentals on Monday, so there was nothing for traders to pay attention to. The downward trend has been formally canceled, but the euro still has big problems with the growth.
As we have already said, almost all of the pair's movement during the day had to be missed, since there was no buy signal at the beginning of this movement. The Kijun-sen line, around which most of the signals were formed, is not strong in a flat, so a whole bunch of false signals formed around it. Unfortunately, these are the costs of the flat. Traders could try to work out the first two signals near the critical line and both signals near the 1.0019 level. In three out of four cases, trades were closed by Stop Loss at breakeven, since the price still moved 15 points in the right direction. In the fourth case, a small loss was received.
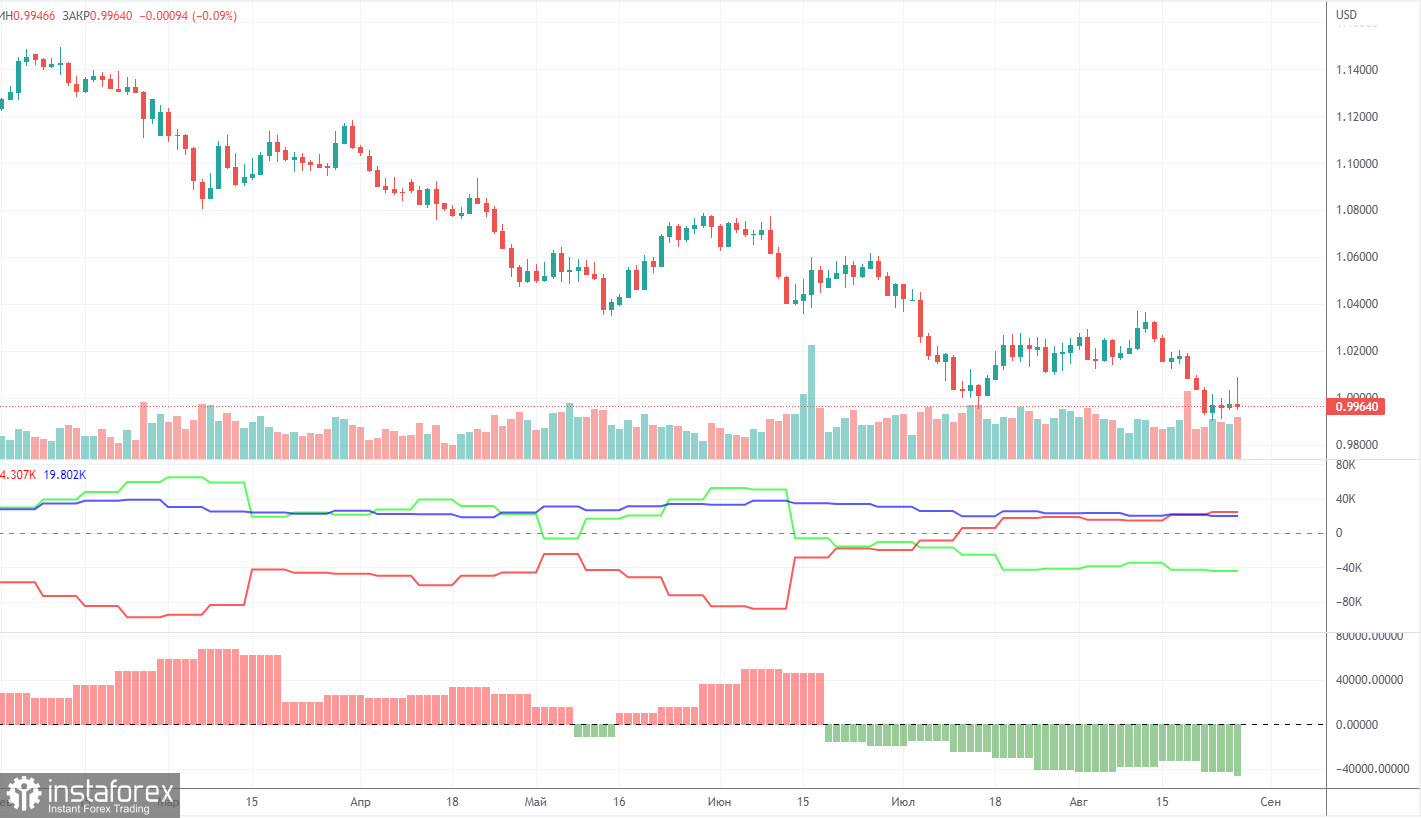
COT report
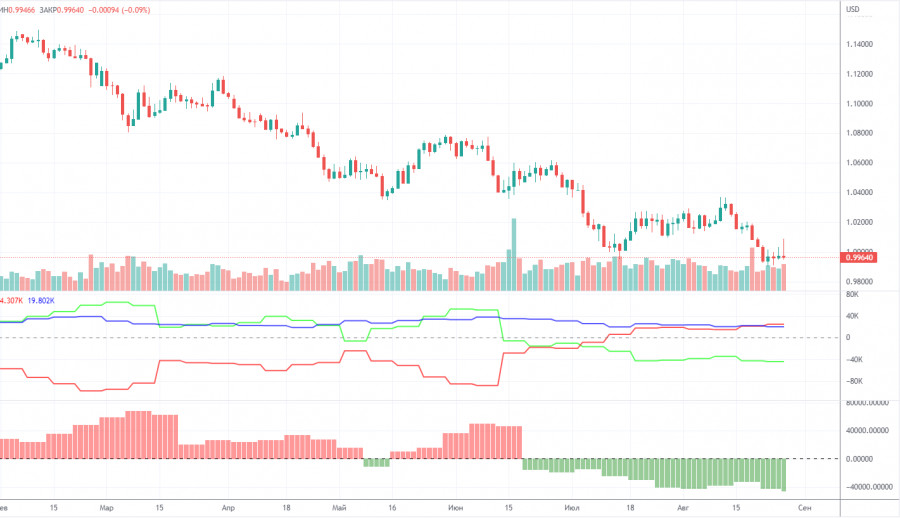
The Commitment of Traders (COT) reports on the euro in the last few months clearly reflect what is happening in the euro/dollar pair. For most of 2022, they showed an openly bullish mood of commercial players, but at the same time, the euro fell steadily at the same time. At this time, the situation is different, but it is NOT in favor of the euro. If earlier the mood was bullish, and the euro was falling, now the mood is bearish and... the euro is also falling. Therefore, for the time being, we do not see any grounds for the euro's growth, because the vast majority of factors remain against it. The number of long positions for the non-commercial group increased by 11,600, and the number of shorts increased by 12,900 during the reporting week. Accordingly, the net position increased by about 1,300 contracts. After several weeks of weak growth, the decline in this indicator resumed, and the mood of major players remains bearish. From our point of view, this fact very eloquently indicates that at this time even professional traders still do not believe in the euro. The number of longs is lower than the number of shorts for non-commercial traders by 44,000. Therefore, we can state that not only the demand for the US dollar remains high, but also the demand for the euro is quite low. The fact that major players are in no hurry to buy the euro may lead to a new, even greater fall. Over the past six months or a year, the euro has not been able to show even a tangible correction, not to mention something more.
We recommend to familiarize yourself with:
Overview of the EUR/USD pair. August 30. The EU inflation report is one of the key events of the week.
Overview of the GBP/USD pair. August 30. The pound has renewed its two-year lows, and the market is waiting for NonFarm Payrolls.
Forecast and trading signals for GBP/USD on August 30. Detailed analysis of the movement of the pair and trading transactions.
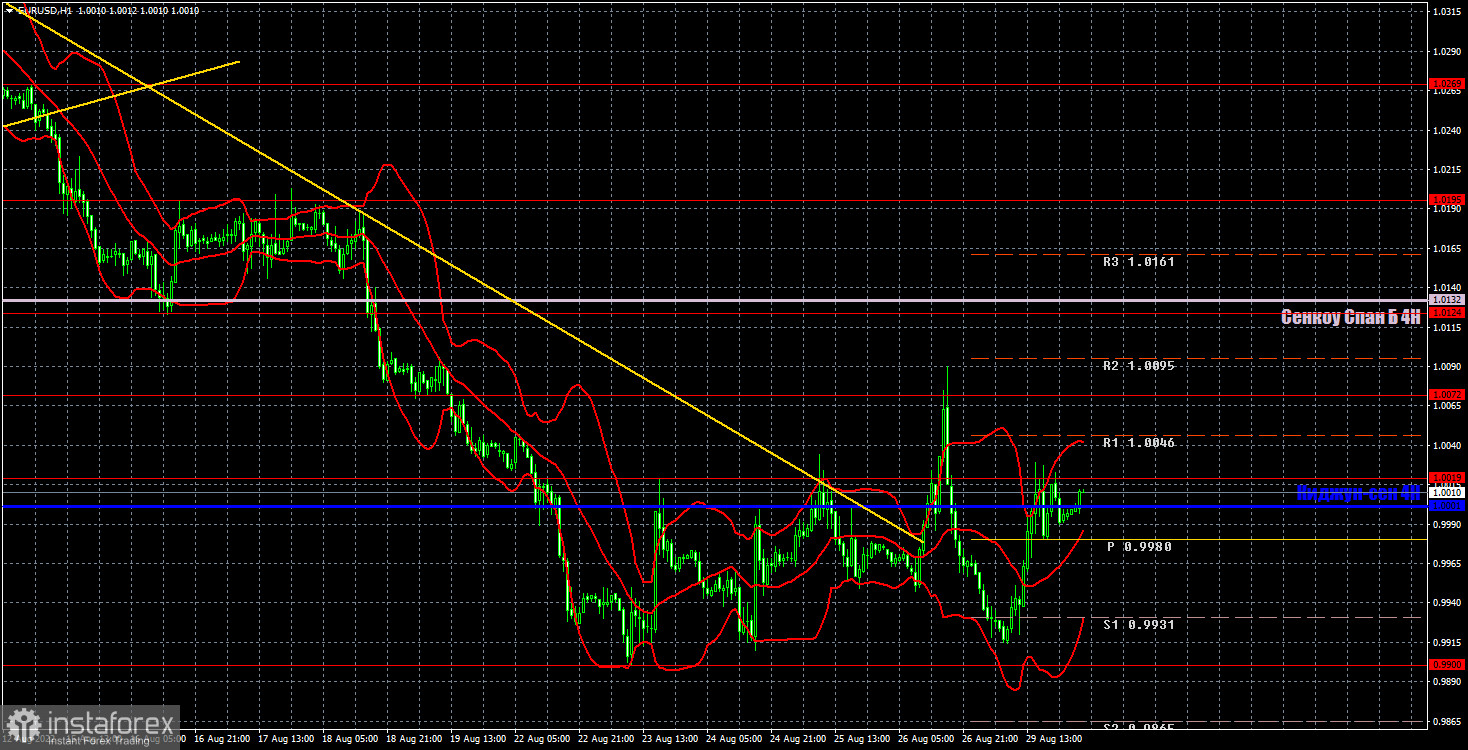
EUR/USD 1H
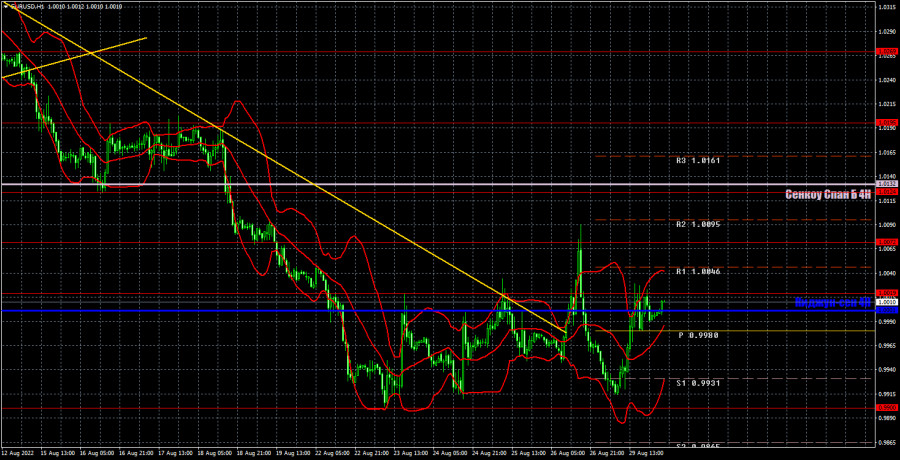
The pair has consolidated above the trend line on the hourly timeframe, but still does not leave the inkling that the downward trend continues. But at the moment, the pair is generally traded inside the horizontal channel, so we trade either between its borders, remembering that the Ichimoku indicator lines are currently weak, or we are waiting for the price to leave the channel. We highlight the following levels for trading on Tuesday - 0.9900, 1.0019, 1.0072, 1.0124, 1.0195, 1.0269, as well as Senkou Span B (1.0132) and Kijun-sen (1.0001). There is not a single level below the level of 0.9900, so there is simply nothing to trade there. Ichimoku indicator lines can move during the day, which should be taken into account when determining trading signals. There are also secondary support and resistance levels, but no signals are formed near them. Signals can be "rebounds" and "breakthrough" extreme levels and lines. Do not forget about placing a Stop Loss order at breakeven if the price has gone in the right direction for 15 points. This will protect you against possible losses if the signal turns out to be false. No important events or reports planned in the European Union and the United States on August 30, so traders will have nothing to pay attention to during the day. At the same time, high volatility may persist.
Explanations for the chart:
Support and Resistance Levels are the levels that serve as targets when buying or selling the pair. You can place Take Profit near these levels.
Kijun-sen and Senkou Span B lines are lines of the Ichimoku indicator transferred to the hourly timeframe from the 4-hour one.
Support and resistance areas are areas from which the price has repeatedly rebounded off.
Yellow lines are trend lines, trend channels and any other technical patterns.
Indicator 1 on the COT charts is the size of the net position of each category of traders.
Indicator 2 on the COT charts is the size of the net position for the non-commercial group.