signal strength 3 of 5

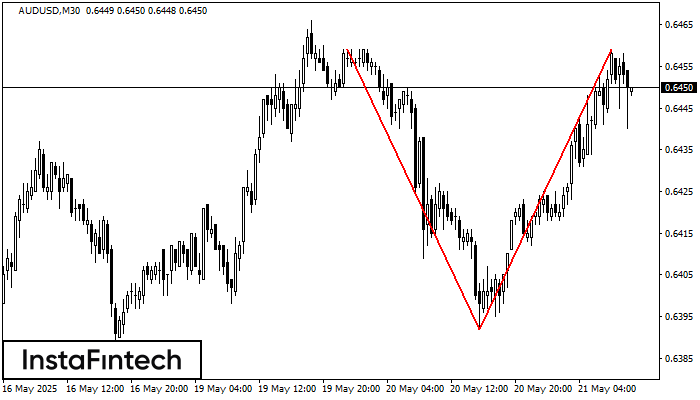
The Double Top pattern has been formed on AUDUSD M30. It signals that the trend has been changed from upwards to downwards. Probably, if the base of the pattern 0.6392 is broken, the downward movement will continue.
انظر أيضا
- All
- Double Top
- Flag
- Head and Shoulders
- Pennant
- Rectangle
- Triangle
- Triple top
- All
- #AAPL
- #AMZN
- #Bitcoin
- #EBAY
- #FB
- #GOOG
- #INTC
- #KO
- #MA
- #MCD
- #MSFT
- #NTDOY
- #PEP
- #TSLA
- #TWTR
- AUDCAD
- AUDCHF
- AUDJPY
- AUDUSD
- EURCAD
- EURCHF
- EURGBP
- EURJPY
- EURNZD
- EURRUB
- EURUSD
- GBPAUD
- GBPCHF
- GBPJPY
- GBPUSD
- GOLD
- NZDCAD
- NZDCHF
- NZDJPY
- NZDUSD
- SILVER
- USDCAD
- USDCHF
- USDJPY
- USDRUB
- All
- M5
- M15
- M30
- H1
- D1
- All
- Buy
- Sale
- All
- 1
- 2
- 3
- 4
- 5
The Triple Bottom pattern has formed on the chart of AUDJPY M5. Features of the pattern: The lower line of the pattern has coordinates 94.44 with the upper limit 94.44/94.36
The M5 and M15 time frames may have more false entry points.
Open chart in a new windowThe Double Bottom pattern has been formed on SILVER M5. This formation signals a reversal of the trend from downwards to upwards. The signal is that a buy trade should
The M5 and M15 time frames may have more false entry points.
Open chart in a new windowAccording to the chart of M30, EURJPY formed the Bullish Symmetrical Triangle pattern, which signals the trend will continue. Description. The upper border of the pattern touches the coordinates 169.76/169.38
Open chart in a new window