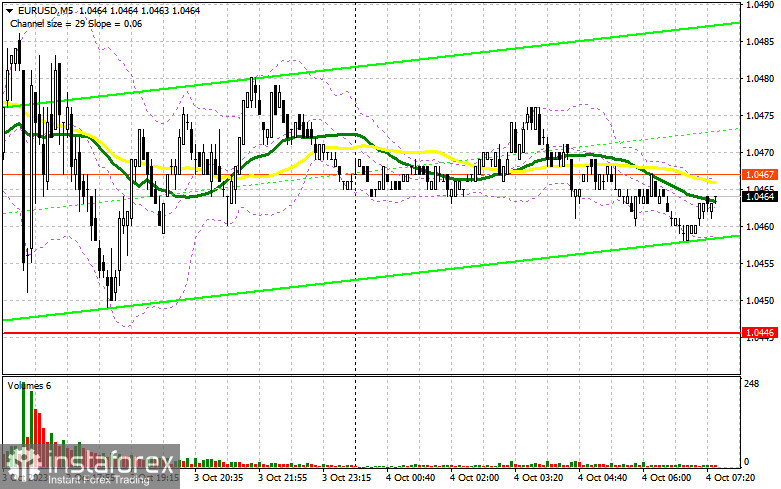
Yesterday, the pair formed just one entry signal. Let's have a look at what happened on the 5-minute chart. In my morning review, I mentioned the level of 1.0481 as a possible entry point. A breakthrough and retest of this mark formed a buy signal in hopes of enabling a bullish correction, but after rising by 10 pips, the pair was under pressure again. In the afternoon, no other good entry points were formed.
For long positions on EUR/USD:
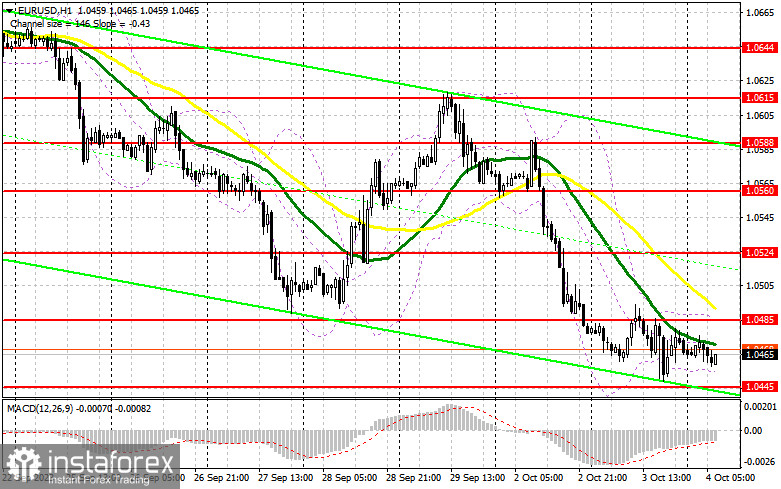
Yesterday, the bulls tried but failed to settle near the daily highs, resulting in a sell-off during the US session and the pair hit a new annual low. It appears that the pair will remain under pressure, as the EU is set to release important data today. The eurozone Services PMI and the composite PMI index for September could be revised downward, indicating further contraction and raise pressure on the pair. Weak data on the euro area Producer Price Index and retail sales for August will also strengthen investors' pessimism towards risky assets, and the speech of European Central Bank President Christine Lagarde is unlikely to influence market sentiment for the better. For this reason, I will act on a decline near the nearest support at 1.0445. A false breakout around that mark will confirm the entry point for long positions, in hopes of building an upward correction and updating the nearest resistance at 1.0485, which is in line with the bearish moving averages. A breakout and a downward test of this range, bolstered by strong data from the eurozone, will increase demand for the euro, providing a chance for a surge to 1.0524. The furthest target would be the 1.0560 area, where I plan to take profits. If EUR/USD declines and there is no activity at 1.0445, the pressure will return. In such a case, only a false breakout near 1.0408 will signal a buying opportunity. I will open long positions directly on a rebound from 1.0367, aiming for an upward correction of 30-35 pips within the day.
For short positions on EUR/USD:
Sellers continue to dominate the market. In this case, the bears need to defend the new resistance at 1.0485 along with weak eurozone data to push the pair to the 1.0445 low. Only after breaching this range and settling below it, on the back of weak eurozone Services PMI data which leads to lower GDP growth rates, and after completing an upward retest, do I anticipate another sell signal with a target at 1.0448 (an annual low), where I expect significant buyer activity. The furthest target is the 1.0408 area, where I plan to take profit. If EUR/USD moves upward during the European session and lacks bearish activity at 1.0485, bulls might attempt an upward correction. In such a scenario, I would delay short positions until the price hits the resistance at 1.0524. I would also consider selling there but only after an unsuccessful consolidation. I will open short positions directly on a rebound from the high of 1.0560, considering a downward correction of 30-35 pips.
COT report:
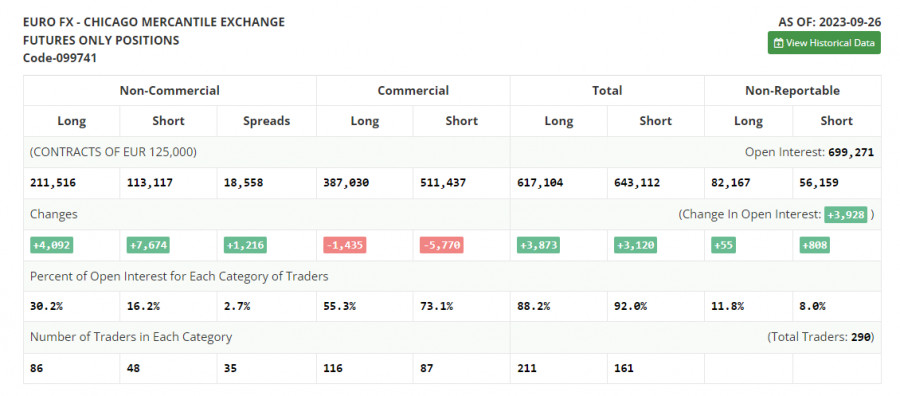
The COT report for September 26 showed a rise in both long and short positions, with the latter being almost twice as many. Adverse shifts in the Eurozone's economic landscape and looming threats of further interest rate hikes by the European Central Bank (ECB) have bolstered the prevailing bearish sentiment. Statements by ECB President Christine Lagarde were quite hawkish. Even the news about slowing inflation in August failed to help the euro withstand pressure from large sellers. A cheaper euro looks more appealing to traders in the medium term which is confirmed by the rise in long positions. The COT report indicates that non-commercial long positions jumped by 4,092 to stand at 211,516, while non-commercial short positions saw an increase of 7,674, reaching a total of 113,117. As a result, the spread between long and short positions increased by 1,216 contracts. The closing price dropped to 1.0604 from 1.0719, further underscoring the bearish market sentiment for EUR/USD.
Indicator signals:
Moving averages:
Trading below the 30- and 50-day moving averages indicates a further downtrend in the pair.
Please note that the time period and levels of the moving averages are analyzed only for the H1 chart, which differs from the general definition of the classic daily moving averages on the D1 chart.
Bollinger Bands
If EUR/USD declines, the indicator's lower border around 1.0450 will serve as support.
Description of indicators:
• A moving average of a 50-day period determines the current trend by smoothing volatility and noise; marked in yellow on the chart;
• A moving average of a 30-day period determines the current trend by smoothing volatility and noise; marked in green on the chart;
• MACD Indicator (Moving Average Convergence/Divergence) Fast EMA with a 12-day period; Slow EMA with a 26-day period. SMA with a 9-day period;
• Bollinger Bands: 20-day period;
• Non-commercial traders are speculators such as individual traders, hedge funds, and large institutions who use the futures market for speculative purposes and meet certain requirements;
• Long non-commercial positions represent the total number of long positions opened by non-commercial traders;
• Short non-commercial positions represent the total number of short positions opened by non-commercial traders;
• The non-commercial net position is the difference between short and long positions of non-commercial traders.