empty
04.10.2023 05:17 AM
Trading plan for GBP/USD on October 4. Simple tips for beginners

Analyzing Tuesday's trades:

GBP/USD on 30M chart

This image is no longer relevant

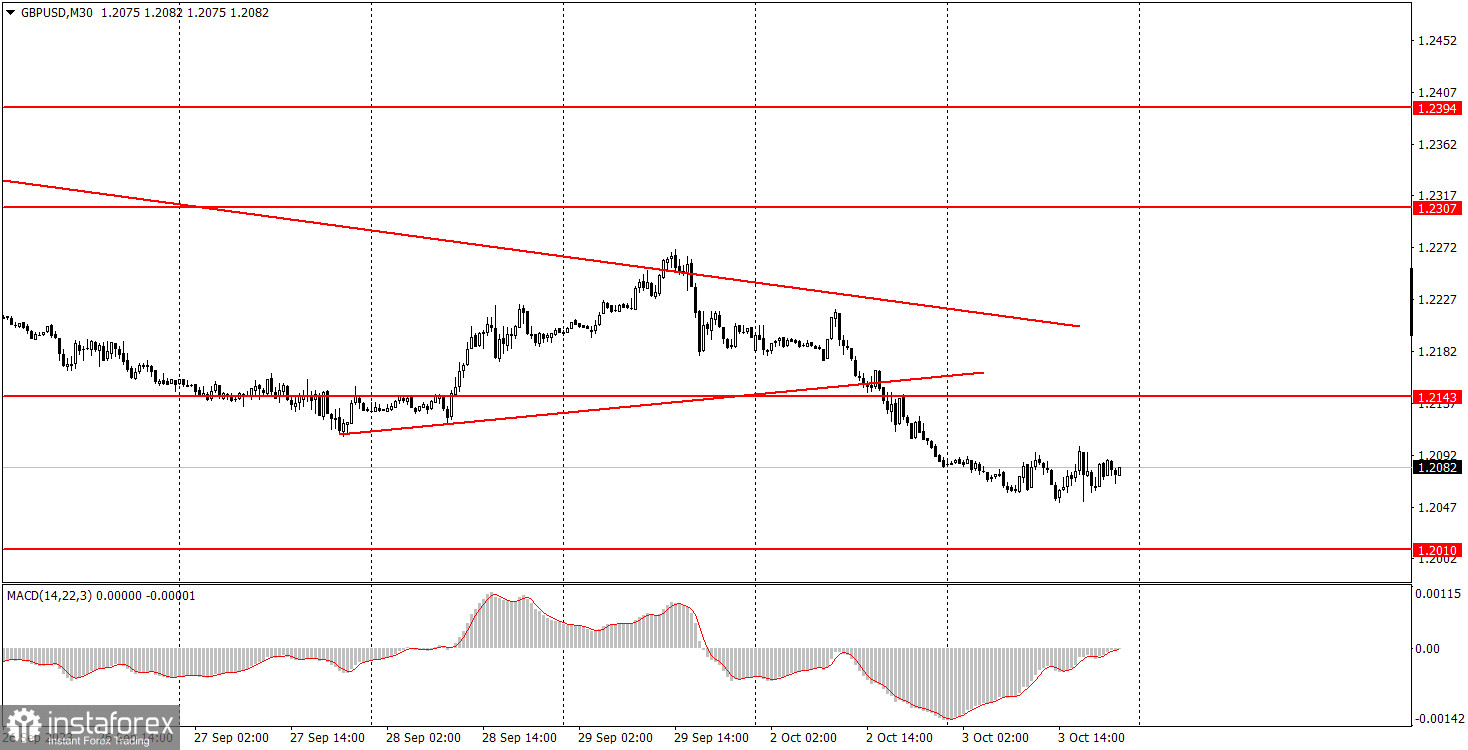
GBPUSD didn't show any interesting movements on Tuesday. Similar to the euro, the British pound stood in the same place for most of the day. While such market behavior is entirely logical when fundamental and macroeconomic news are scarce, it was not much different from Monday when we saw a significant drop in quotes, even though a rise would have been more logical.

As of now, we believe that the downtrend will persist, and the pound will continue to fall. However, a correction is still looming and it would be more logical for the pound to start a corrective phase that than to fall further. Perhaps the market is waiting for important events and news so it can start buying again. Crucial data on the US labor market and unemployment will be released on Friday. But for now we don't see how these reports could particularly help the pound.

GBP/USD on 5M chart

This image is no longer relevant

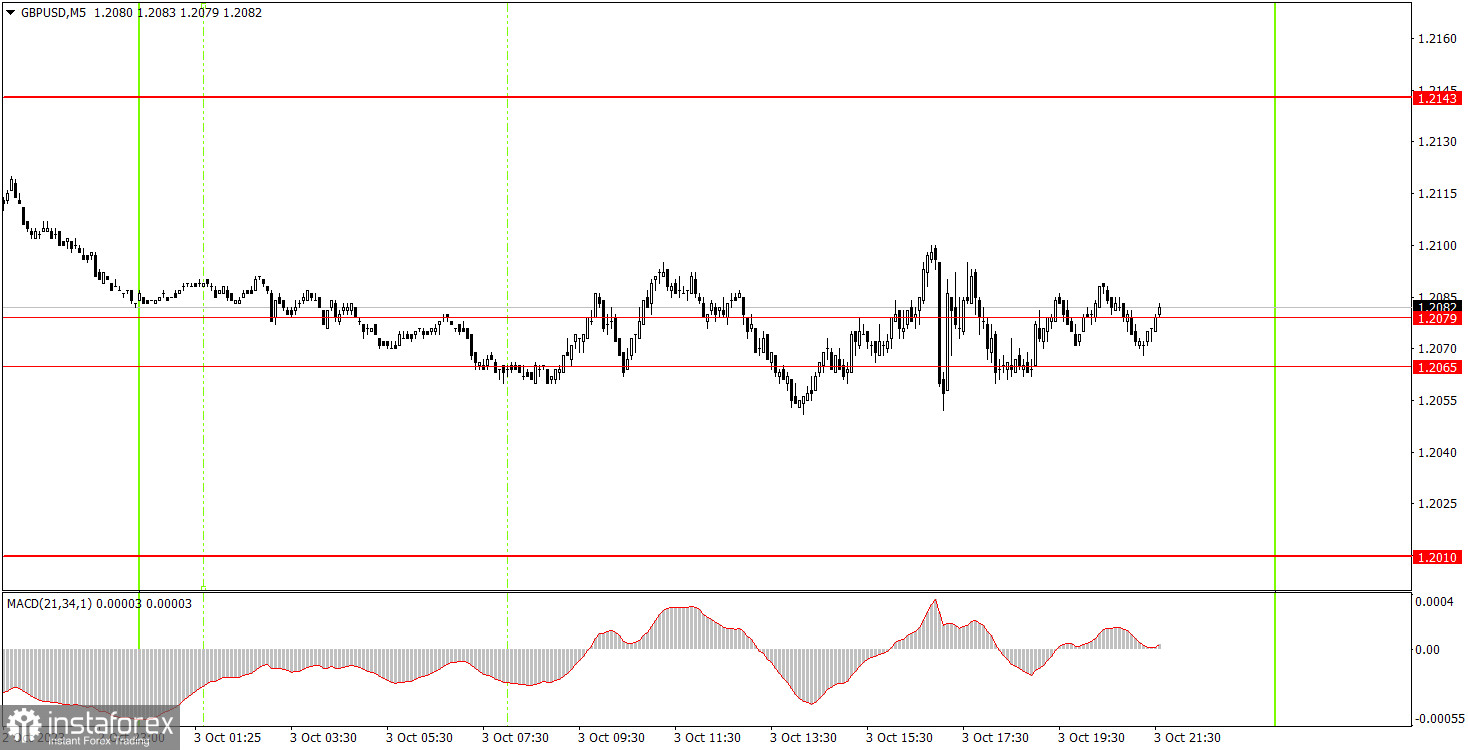
On the 5-minute chart, the pair moved sideways along the 1.2065-1.2079 range throughout the day. Naturally, more than a dozen false signals were generated in this area, making it meaningless to execute them. The most challenging aspect was identifying the flat on Tuesday. We assume that beginners may have opened a trade during the European session, but in the future, there should not have been such errors since the flat was clearly visible.

Trading tips on Wednesday:

On the 30-minute chart, GBP/USD has ended its bullish correction and can now resume its downward movement. However, we believe that the pound may trade higher for quite some time, even without specific fundamental and macroeconomic reasons behind it. We expect the pound to resume its decline in the medium term since the British currency has been rising for too long and without a solid basis. But a corrective phase would be more logical at the moment. The key levels on the 5M chart are 1.1992-1.2010, 1.2065-1.2079, 1.2143, 1.2171-1.2179, 1.2235, 1.2307, 1.2372-1.2394, 1.2457-1.2488, 1.2544, 1.2605-1.2620. Once the price moves 20 pips in the right direction after opening a trade, you can set the stop-loss at breakeven. On Wednesday, the UK will publish the final estimate of the Services PMI for September, and the US will release the ADP report and the ISM Services PMI. Market participants will keep an eye on the US data and this should be sufficient to stir some market reaction, so the volatility may gradually increase.

Basic trading rules:

1) The strength of the signal depends on the time period during which the signal was formed (a rebound or a break). The shorter this period, the stronger the signal.

2) If two or more trades were opened at some level following false signals, i.e. those signals that did not lead the price to Take Profit level or the nearest target levels, then any consequent signals near this level should be ignored.

3) During the flat trend, any currency pair may form a lot of false signals or do not produce any signals at all. In any case, the flat trend is not the best condition for trading.

4) Trades are opened in the time period between the beginning of the European session and until the middle of the American one when all deals should be closed manually.

5) We can pay attention to the MACD signals in the 30M time frame only if there is good volatility and a definite trend confirmed by a trend line or a trend channel.

6) If two key levels are too close to each other (about 5-15 pips), then this is a support or resistance area.

How to read charts:

Support and Resistance price levels can serve as targets when buying or selling. You can place Take Profit levels near them.

Red lines are channels or trend lines that display the current trend and show which direction is better to trade.

MACD indicator (14,22,3) is a histogram and a signal line showing when it is better to enter the market when they cross. This indicator is better to be used in combination with trend channels or trend lines.

Important speeches and reports that are always reflected in the economic calendars can greatly influence the movement of a currency pair. Therefore, during such events, it is recommended to trade as carefully as possible or exit the market in order to avoid a sharp price reversal against the previous movement.

Beginners should remember that every trade cannot be profitable. The development of a reliable strategy and money management are the key to success in trading over a long period of time.

Paolo Greco,
الخبير التحليلي لدى شركة إنستافوركس
© 2007-2025
حدد الإطار الزمني
5
د
15
د
30
د
1
س
4
ساعات
1
يوم
1
أسبوع
كسب عائد من تغيرات أسعار العملات المشفرة مع إنستافوركس.
قم بتحميل منصة التداول ميتاتريدر 4 وافتح أول صفقة.
  • Grand Choice
    Contest by
    InstaForex
    InstaForex always strives to help you
    fulfill your biggest dreams.
    انضم إلى المسابقة

المقالات الموصى بها

كيفية تداول زوج الجنيه الإسترليني/الدولار الأمريكي في 11 يونيو؟ نصائح بسيطة وتحليل التداول للمبتدئين

في يوم الثلاثاء، تداول زوج الجنيه الإسترليني/الدولار الأمريكي مع ميل هبوطي، وهو ما كان مبررًا بعدة عوامل. أولاً، استقر الزوج تحت خط الاتجاه الصاعد. لا نعتقد أن اتجاهًا هبوطيًا جديدًا

Paolo Greco 06:10 2025-06-11 UTC+2

كيفية تداول زوج اليورو/الدولار الأمريكي في 11 يونيو؟ نصائح بسيطة وتحليل التداول للمبتدئين

في يوم الثلاثاء، أظهر زوج العملات EUR/USD مرة أخرى عدم نيته في التداول النشط. خلال الأيام الثلاثة الماضية، تشكلت قناة جانبية على الإطار الزمني للساعة، وظلت تقلبات الزوج منخفضة جدًا

Paolo Greco 06:10 2025-06-11 UTC+2

توصيات وتحليل التداول لزوج الجنيه الإسترليني/الدولار الأمريكي في 11 يونيو: الجنيه يتوقف قبل اندفاع جديد

واصل زوج العملات GBP/USD التداول بطريقة فوضوية إلى حد ما يوم الثلاثاء، ولكن مع نغمة هبوطية. انخفض الجنيه الإسترليني قليلاً على الأقل بعد أن تحول الاتجاه إلى الأسفل. نذكر

Paolo Greco 03:31 2025-06-11 UTC+2

توصيات وتحليل التداول لزوج اليورو/الدولار الأمريكي في 11 يونيو: حركة مسطحة عند القمم

واصل زوج العملات EUR/USD التحرك في كلا الاتجاهين طوال يوم الثلاثاء. تشير هذه التحركات إلى سوق مسطح. دعونا نتذكر أنه في وقت سابق، اخترق الزوج خط الاتجاه الصاعد للمرة الثانية،

Paolo Greco 03:31 2025-06-11 UTC+2

GBP/USD: خطة التداول للجلسة الأمريكية في 10 يونيو (مراجعة التداولات الصباحية)

في توقعاتي الصباحية، لفتُّ الانتباه إلى مستوى 1.3545 وخططت لاتخاذ قرارات دخول السوق بناءً عليه. دعونا نلقي نظرة على الرسم البياني لمدة 5 دقائق لنرى ما حدث. أدى الارتفاع يليه

Miroslaw Bawulski 18:26 2025-06-10 UTC+2

EUR/USD: خطة التداول للجلسة الأمريكية في 10 يونيو (مراجعة تداولات الصباح)

في توقعاتي الصباحية، قمت بتسليط الضوء على مستوى 1.1388 وخططت لاتخاذ قرارات دخول السوق بناءً عليه. دعونا نلقي نظرة على الرسم البياني لمدة 5 دقائق لنرى ما حدث. أدى الانخفاض

Miroslaw Bawulski 18:22 2025-06-10 UTC+2

كيفية تداول زوج الجنيه الإسترليني/الدولار الأمريكي في 10 يونيو؟ نصائح بسيطة وتحليل التداول للمبتدئين

تداول زوج الجنيه الإسترليني/الدولار الأمريكي في كلا الاتجاهين يوم الاثنين. يوم الجمعة، استقرت الأسعار تحت خط الاتجاه الصاعد، مما غيّر الاتجاه رسميًا إلى هبوطي. رسميًا - لأننا رأينا شيئًا مشابهًا

Paolo Greco 06:40 2025-06-10 UTC+2

كيفية تداول زوج اليورو/الدولار الأمريكي في 10 يونيو؟ نصائح بسيطة وتحليل التداول للمبتدئين

تداول زوج العملات EUR/USD بتقلب منخفض وفي كلا الاتجاهين يوم الاثنين. في ذلك اليوم، كان السياق الاقتصادي الكلي غائبًا تقريبًا، مما ترك المتداولين مع القليل جدًا للتفاعل معه. بالطبع، تستمر

Paolo Greco 06:40 2025-06-10 UTC+2

توصيات وتحليلات التداول لزوج الجنيه الإسترليني/الدولار الأمريكي في 10 يونيو: الجنيه ليس في عجلة من أمره للهبوط أيضًا

في يوم الاثنين، فشل زوج العملات GBP/USD بشكل متوقع في مواصلة حركته الهبوطية. نذكر أنه في وقت سابق، شكل السعر مرة أخرى إشارة لانعكاس الاتجاه إلى الاتجاه الهبوطي

Paolo Greco 04:11 2025-06-10 UTC+2

توصيات وتحليل التداول لليورو/الدولار الأمريكي في 10 يونيو: يوم آخر، وجرعة أخرى من السلبية

تداول زوج العملات EUR/USD بشكل متباين طوال يوم الاثنين. وعلى الرغم من كسر خط الاتجاه، إلا أن الحركة الهبوطية (أي تقوية الدولار الأمريكي) لم تبدأ فعليًا. وبالتالي، لا تزال الإشارات

Paolo Greco 04:11 2025-06-10 UTC+2
لا تستطيع التحدث الآن؟
اطرح سؤالك في الدردشة.
Widget callback
 

Dear visitor,

Your IP address shows that you are currently located in the USA. If you are a resident of the United States, you are prohibited from using the services of InstaFintech Group including online trading, online transfers, deposit/withdrawal of funds, etc.

If you think you are seeing this message by mistake and your location is not the US, kindly proceed to the website. Otherwise, you must leave the website in order to comply with government restrictions.

Why does your IP address show your location as the USA?

  • - you are using a VPN provided by a hosting company based in the United States;
  • - your IP does not have proper WHOIS records;
  • - an error occurred in the WHOIS geolocation database.

Please confirm whether you are a US resident or not by clicking the relevant button below. If you choose the wrong option, being a US resident, you will not be able to open an account with InstaForex anyway.

We are sorry for any inconvenience caused by this message.